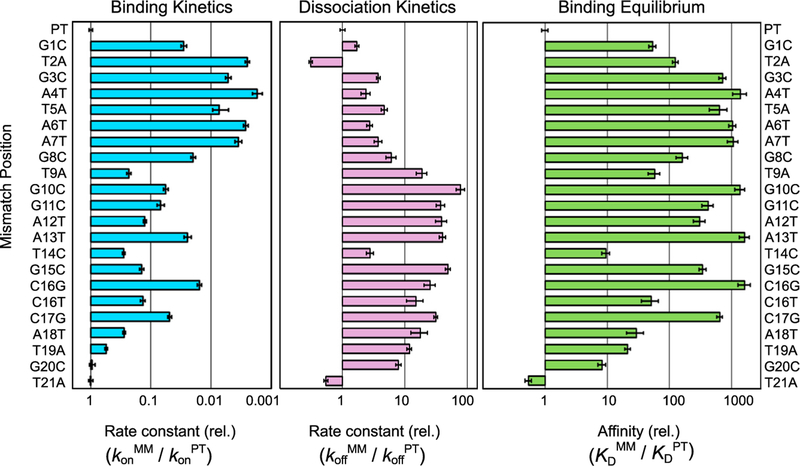
Figure 3. Mismatches throughout the R-Loop Reduce the Affinity of Cas12a for Target DNA.
Bar graphs, left and center, represent the rates of binding and dissociation, respectively, of Cas12a for a mismatched target (MM) normalized by the corresponding rates for the matched (i.e., perfect) target DNA (PT). The combination of the relative rate constants gives the overall effect on affinity, as depicted in the graph at the right. Error bars in the left and center panels represent the normalized SE of the fit and the normalized SEM (n ≥ 3) for binding and dissociation, respectively. Error bars in the right panel reflect the propagated errors from binding and dissociation reactions. Target names are defined as the mismatch position and substituted nucleotide within the NTS.

