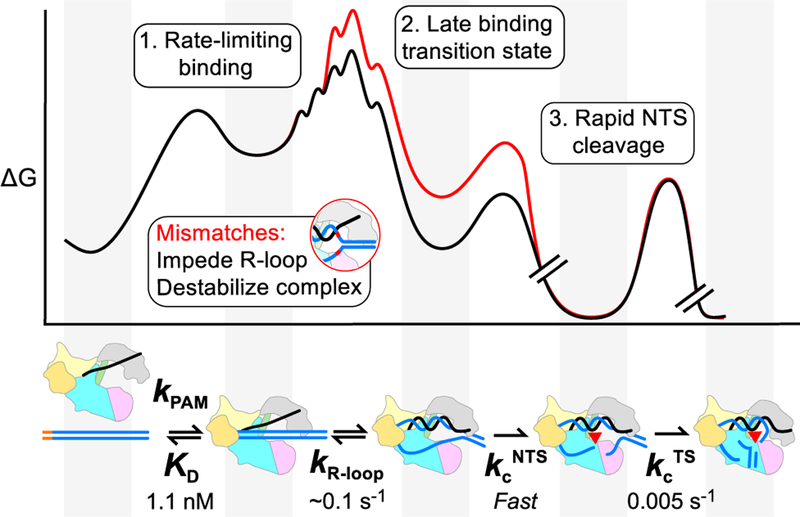
Figure 5. Model and Kinetic Framework for Cas12a Target Recognition and Cleavage.
Cas12a specificity is determined during R-loop formation. Due to the late transition state for R-loop formation, Cas12a is able to discriminate against mismatches across the R-loop. Cleavage of the NTS strand occurs rapidly (kcNTS), so that R-loop formation is rate limiting for cleavage even under saturating conditions. TS cleavage occurs ~10-fold more slowly (kcTS). A mismatch (red curve) increases the energy barrier for R-loop formation, resulting in a decreased rate of R-loop formation with no direct effect on the DNA cleavage steps. Breaks in the free energy profile indicate irreversible cleavage steps. Valleys correspond to the ground states of Cas12a, shown in the cartoon below the profile (aligned by gray panels).

