Figure 3.
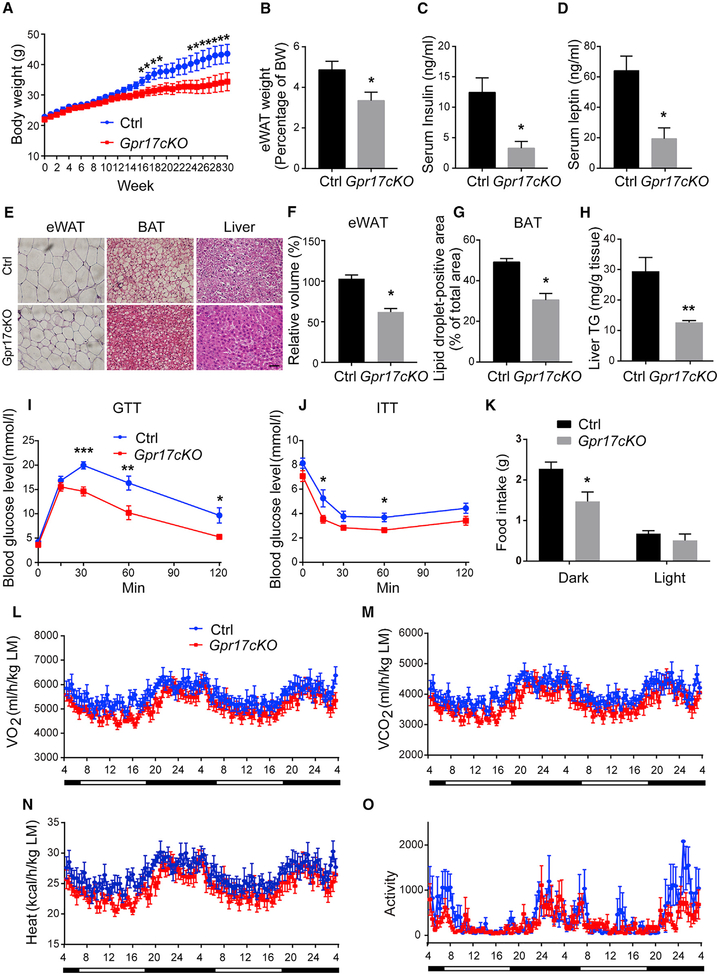
Loss of Oligodendrocytic GPR17 Protects against HFD-Induced Obesity (A–H) Gpr17cKO (Olig1cre/+;Gpr17fl/fl) and control (Gpr17fl/fl) mice were subjected to HFD feeding initiated at 8 weeks of age. The mice were sacrificed, and tissue samples were collected after 30 weeks on the HFD.
(A) Body weight recorded weekly.
(B) Weight of eWAT.
(C) Serum levels of insulin.
(D) Serum levels of leptin.
(E) Representative images of H&E stained eWAT, BAT, and liver. Scale bar, 50 μm.
(F) The volume of the adipocytes in eWAT.
(G) Lipid droplet-positive area in the BAT.
(H) Triglyceride content in the liver.
(I) GTT at 24 weeks of HFD.
(J) ITT at 25 weeks of HFD.
(K) The food intake of control and Gpr17cKO mice.
(L–O) Metabolic parameters of Gpr17cKO and WT mice after 26 weeks of HFD feeding, normalized by lean body mass. Shown are (L) O2 consumption, (M) CO2 production, (N) heat production, and (O) ambulatory activity during 48 h of dark and light cycles.
Open and filled bars represent light and dark phases, respectively. Each value represents mean ± SEM of 11 mice per genotype. *p < 0.05, **p < 0.01, ***p < 0.001, Student’s t test.

