Figure 5.
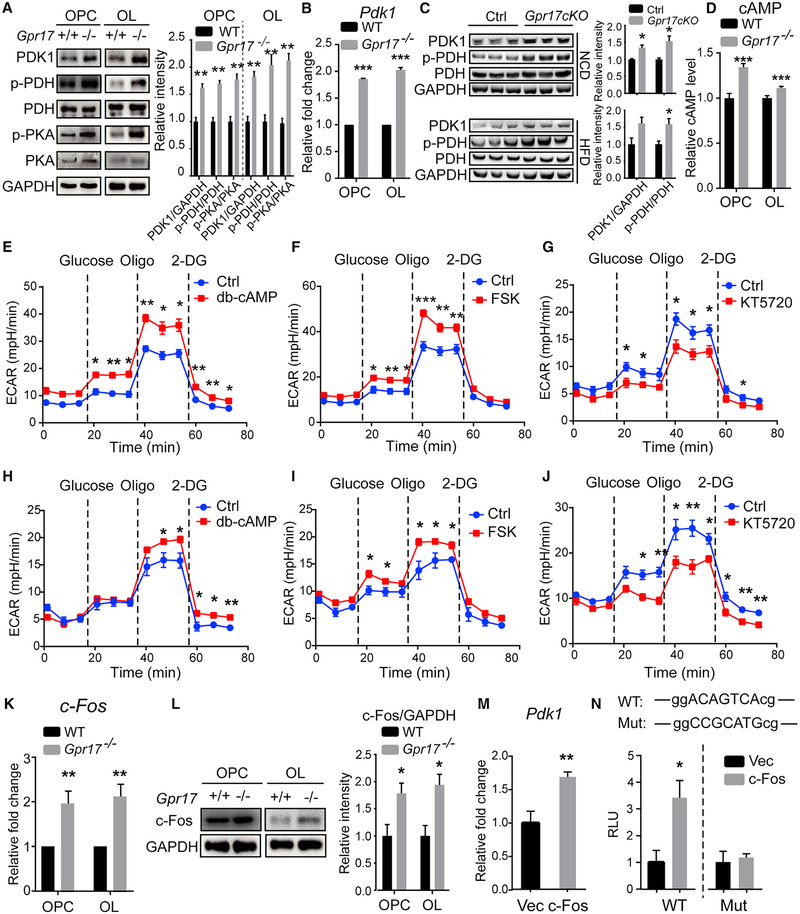
Ablation of Gpr17 Increases Pdk1 Expression through cAMP-PKA Signaling (A) Total proteins isolated from primary OPCs and OLs from WT or Gpr17−/− mice were subjected to western blot using the indicated antibodies. The relative band intensity of each protein is shown on the right. The experiments were repeated 3 times.
(B) Total RNAs were isolated, and Pdk1 was quantified by real-time PCR. n = 3 animals/genotype.
(C) Total protein was extracted from the hypothalamus of Gpr17fl/fl and Gpr17cKO mice fed the NCD or HFD for 30 weeks and subjected to western blot using the indicated antibodies. The relative intensity of each band is shown on the right panel. n = 3 animals/genotype.
(D) Intracellular cAMP levels in OPCs and OLs from WT or Gpr17−/− mice.
(E–J) ECAR after sequential administration of 10 mM glucose, 1.5 μM oligomycin, and 50 mM 2-DG of (E) WT OPCs treated with 0.5 mM dibutyl-cAMP (db-cAMP),(F) WT OPCs treated with 10 mM forskolin (FSK), (G) Gpr17−/− OPCs treated with 0.5 μM KT5720, (H) WT OLs treated with 0.5 mM db-cAMP, (I) WT OLs treated with 10 μM FSK, and (J) Gpr17−/− OLs treated with 0.5 μM KT5720. Dotted lines indicate the starting point of treatment with the indicated compounds.
(K) Total RNAs were isolated, and c-Fos was quantified detected by real-time PCR as described in the STAR Methods.
(L) Total proteins isolated from primary OPCs and OLs from WT or Gpr17−/− mice were subjected to western blot using the indicated antibodies. The relative band intensity of each protein is shown on the right. n = 3 animals/genotype.
(M) OLN-93 cells were transfected with an empty vector (Vec) or the c-Fos-expressing construct pBOB-c-Fos (c-Fos) for 48 h. Total mRNA was harvested, and Pdk1 mRNA was quantified by real-time PCR.
(N) HEK293T cells were co-transfected with empty Vec or pBOB-c-Fos and the Pdk1 promoter constructs containing a WT or mutated c-Fos response element. Luciferase activities were assayed 24 h after transfection.
Data were reproduced from at least three independent experiments. Each value represents mean ± SEM. *p < 0.05, **p < 0.01, ***p < 0.001, Student’s t test.

