Figure 6.
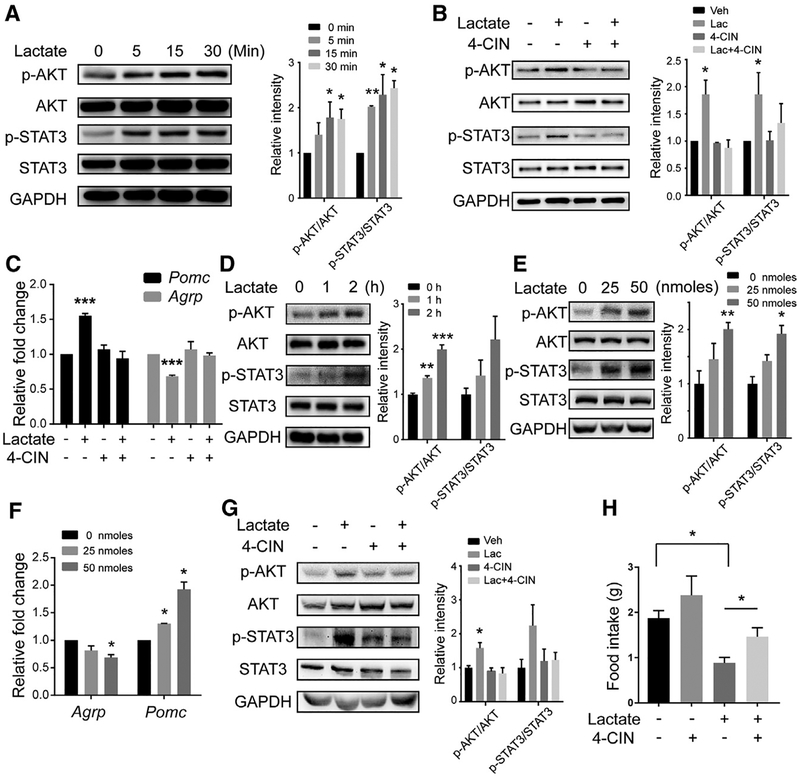
Hypothalamic Administration of Lactate Modulates Appetite through Activation of AKT and STAT3 Signaling (A) Primary hypothalamus neurons were treated with 20 mM lactate. Left: levels of phosphorylated AKT (p-AKT) and phosphorylated STAT3 (p-STAT3) were analyzed by western blotting. Right: Relative intensities of p-AKT or p-STAT3 normalized to total AKT or STAT3. n = 3 independent experiments.
(B) Neurons were pretreated with 0.25 mM 4-CIN for 15 min and then treated with 20 mM lactate for 15 min. Left: the levels of p-AKT and p-STAT3 were analyzed by western blotting. Right: relative intensities of p-AKT or pSTAT3 normalized to total AKT or STAT3. n = 3 independent experiments.
(C) The relative mRNA levels of Pomc and Agrp were measured by real-time qPCR in neurons treated with 0 (−) or 20 mM (+) lactate for 1 h with or without a 15-min pretreatment with 0.25 mM 4-CIN.(D and E) WT 8-week-old mice received i.c.v. microinjections of 50 nmol lactate (D) and were sacrificed after the indicated time or (E) received the indicated dose of lactate and were sacrificed after 120 min. Left: total hypothalamic proteins were extracted and subjected to western blot using the indicated antibodies. Right: relative intensities of p-AKT or p-STAT3 normalized to total AKT or STAT3. n = 3 independent experiments.(F) WT 8-week-old mice received i.c.v. microinjections of saline or 25 or 50 nmol of lactate. Hypothalamus samples were collected 6 h after the injections. The relative mRNA levels of Pomc and Agrp were measured by real-time qPCR. (G and H) Mice were injected i.c.v. with 50 nmol of lactate with or without a 1-h pretreatment with 40 nmol 4-CIN.
(G) Left: mice were sacrificed 2 h after injection of lactate, and hypothalamus samples were subjected to western blot using the indicated antibodies. Right: relative intensities of p-AKT or p-STAT3 normalized to total AKT or STAT3. n = 3 independent experiments.
(H) Mice (n = 6/group) were subjected to 24-h food intake measurement.
Each value represents mean ± SEM from three independent experiments. *p < 0.05, ***p < 0.001, Student’s t test.

