Figure 7.
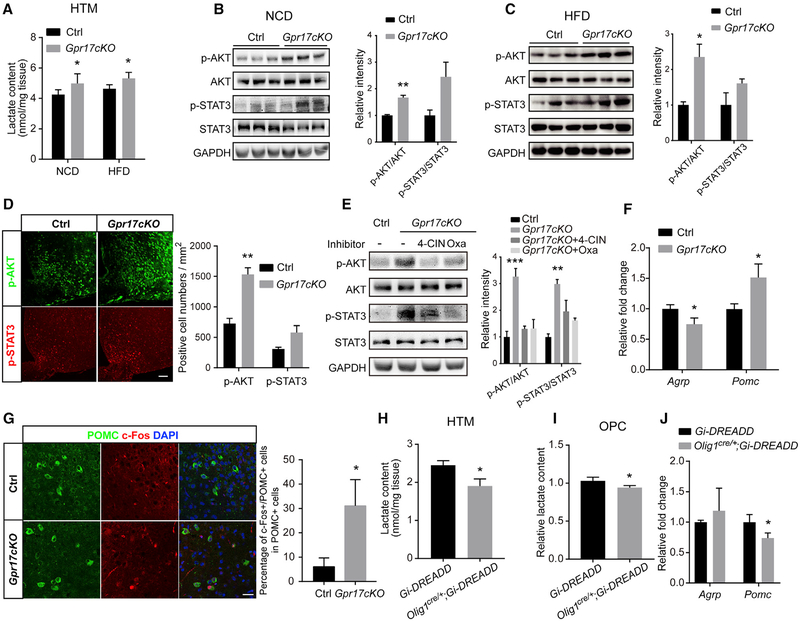
Depletion of Gpr17 or Activation of OLs Regulates AgRP and POMC Neuron Activity (A) Lactate was quantified in hypothalamus samples from Gpr17fl/fl (control [Ctrl]) and Gpr17cKO mice subjected to either NCD or HFD feeding for 30 weeks (n = 6 animals/genotype).
(B) Left: hypothalamus samples from mice fed the NCD were analyzed by western blot using the indicated antibodies. Right: relative intensities of p-AKT or p-STAT3 normalized to total AKT or STAT3. n = 3 animals/genotype.
(C) Left: hypothalamus samples from mice fed the HCD were analyzed by western blot using the indicated antibodies. Right: relative intensities of p-AKT or p-STAT3 normalized to total AKT or STAT3. n = 3 animals/genotype.
(D) Left: immunofluorescent staining for p-AKT or p-STAT3 of cryostat sections from representative hypothalamus samples of Gpr17fl/fl and Gpr17cKO mice after 30 weeks of HFD feeding. Scale bar, 50 μm. Right: quantification of samples from 3 mice.
(E) NCD-fed Gpr17cKO mice were injected i.c.v. with 4-CIN or oxamate (Oxa). Left: after 12 h, total protein samples were collected from the hypothalamus and subjected to western blot using the indicated antibodies. Right: the relative band intensity of each protein. n = 3 animals/group.
(F) After 30 weeks of HFD feeding, the levels of Pomc and Agrp in the hypothalamus of Gpr17fl/fl and Gpr17cKO mice were measured by real-time qPCR (n = 9 animals/genotype).
(G) Immunofluorescent staining for POMC and c-Fos in the hypothalamus of Gpr17fl/fl and Gpr17cKO mice after 30 weeks of HFD. Scale bar, 25 μm.(H and J) Lactate content (H) and mRNA (J) levels of Pomc and Agrp in the hypothalamus of Gi-DREADD or Olig1cre/+;Gi-DREADD mice treated with CNO (1 mg/kg) at P12 for 2 h (n = 5 animals/genotype).
(I) Relative lactate content of isolated OPCs from Gi-DREADD or Olig1cre/+;Gi-DREADD mice with CNO treatment (5 μM) for 2 h (n = 3 independent experiments). Each value represents mean ± SEM from three independent experiments.
All quantifications of immunofluorescent staining were obtained from at least nine images from three mice. Each value represents mean ± SEM. *p < 0.05, **p < 0.01, Student’s t test.

