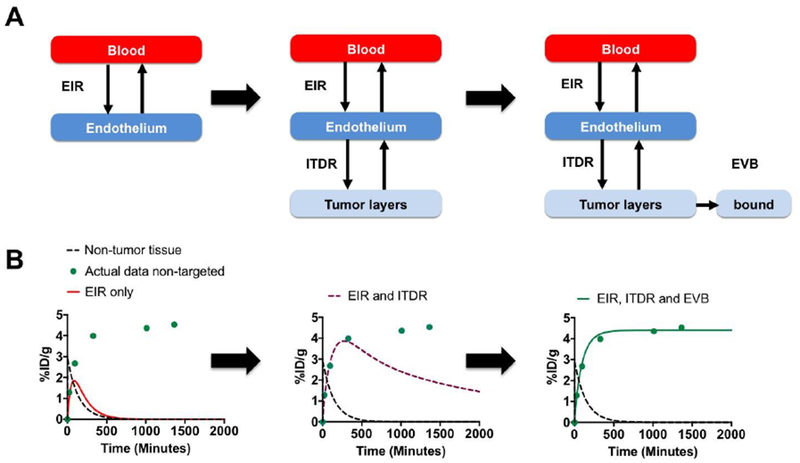
Figure 2. Algorithm for describing pharmacokinetic profile of non-targeted nanoparticles with the model:

A) simplified schematic of the PK model (based on Fig. 1) shows compartments used in each step; B) actual data for targeted nanoparticles (Table 1) were plotted as %ID/g over time (green circles). Each step corresponds to the schematic above. The tumor profile cannot be described by EIR only, as nanoparticles rapidly wash out (left graph, red line); addition of ITDR improves the profile, but nanoparticles are still being washed out from the tumor (center graph, purple dashed line); addition of EVB into the model achieves a good correlation with the data (right graph, green line).
