
Figure 5.
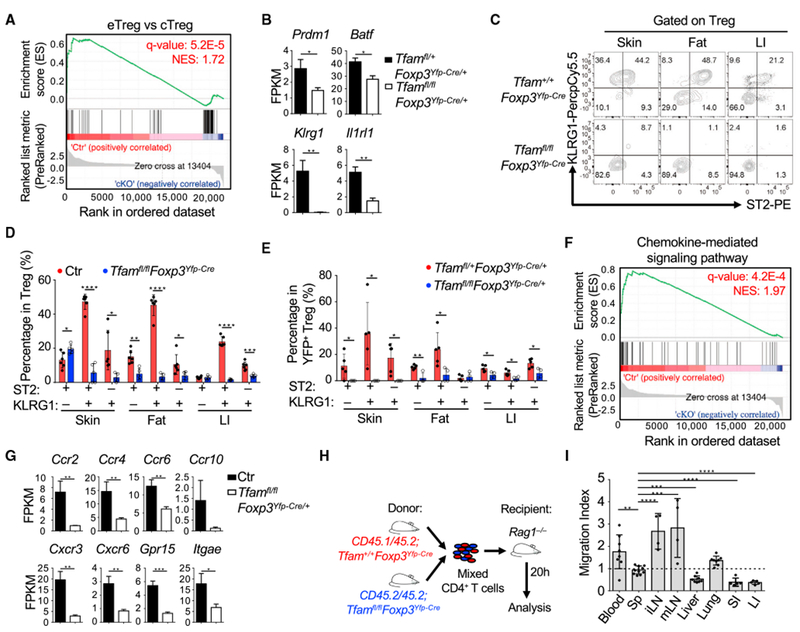
Tfam Is Essential for ST2+KLRG1+ Treg Generation and Controls Treg Homing
(A) GSEA analysis of all expressed genes (RNA-seq FPKM ≥ 1) in YFP+ Tregs from pooled Sp and peripheral LNs of Tfamfl/+Foxp3Yfp-Cre/+ (Ctr) and Tfamfl/flFoxp3Yfp-Cre/+ (cKO) female mice.
(B) FPKM values of the indicated genes of Tregs from Tfamfl/+Foxp3Yfp-Cre/+ (n = 3) and Tfamfl/flFoxp3Yfp-Cre/+ mice (n = 3).
(C) Flow cytometry staining of ST2 and KLRG1 in Tregs from 6-week-old mice of the indicated genotypes. Data are representative of three independent experiments.
(D) Percentages of ST2+KLRG1+ Tregs, ST2−KLRG1+ Tregs, and ST2+KLRGT Tregs (Ctr group includes Tfam+/+Foxp3Yfp-Cre and Tfamfl/+Foxp3Yfp-Cre, n = 6; Tfamfl/flFoxp3Yfp-Cre, n = 5). Data were compiled from two independent experiments.
(E) Percentages of ST2+KLRG1+ Tregs, ST2+KLRG1+ Tregs, and ST2+KLRG1− Tregs in Tfamfl/+Foxp3Yfp-Cre/+ (n = 5) and Tfamfl/fl Foxp3Yfp-Cre/+ (n = 4) female mice. Data were compiled from two independent experiments.
(F) GSEA analysis of all expressed genes (RNA-seq FPKM ≥ 1) between Ctr and cKO Tregs as described in (A).
(G) FPKM values of several differentially expressed chemokine receptors of Tregs from Ctr (Tfamfl/+Foxp3Yfp-Cre/+) (n = 3) and Tfamfl/flFoxp3Yfp-Cre/+ (n = 3) mice.
(H) Experimental design of the in vivo Treg homing or retention experiment.
(I) In vivo Treg homing or retention (migration index) as described in Figure S5E. Treg migration indices were normalized to the original ratio of CD45.1+CD45.2+ Ctr (Tfam+/+Foxp3YfpCre) Tregs/CD45.1−CD45.2+ Tfam-deficient (Tfamfl/flFoxp3Yfp-Cre) Tregs. Data were compiled from four independent experiments (n = 8 for blood, liver, and lungs; n = 11 for Sp; n = 4 for iLNs and mLNs; n = 5 for SI and LI).
The data in (B), (D), (E), (G), and (I) are shown as mean ± SD.