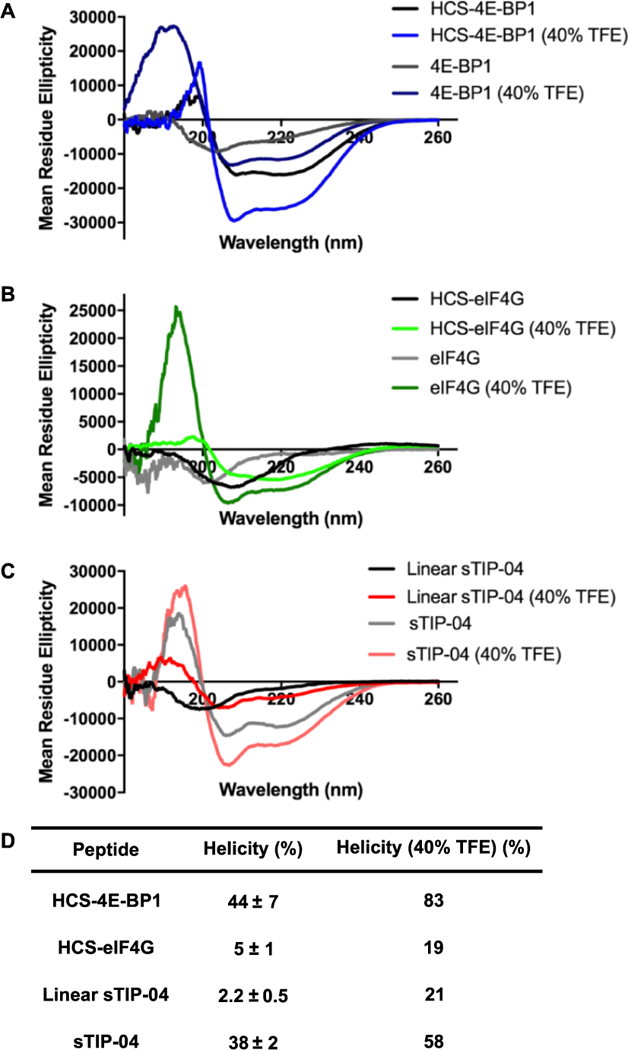
Figure 5.

Stapled peptide helicities as determined via CD spectroscopy in 5 mM sodium phosphate buffer, pH 7.4, 25 °C. (A) 4E-BP1 and HCS-4E-BP1 spectra. (B) eIF4G and HCS-eIF4G spectra. (C) Linear and sTIP-04 spectra. (D) Table of average helicity values measured at 25–100 μM ± standard deviation across the concentrations tested. For the TFE experiments, only 100 μM peptide was used.
