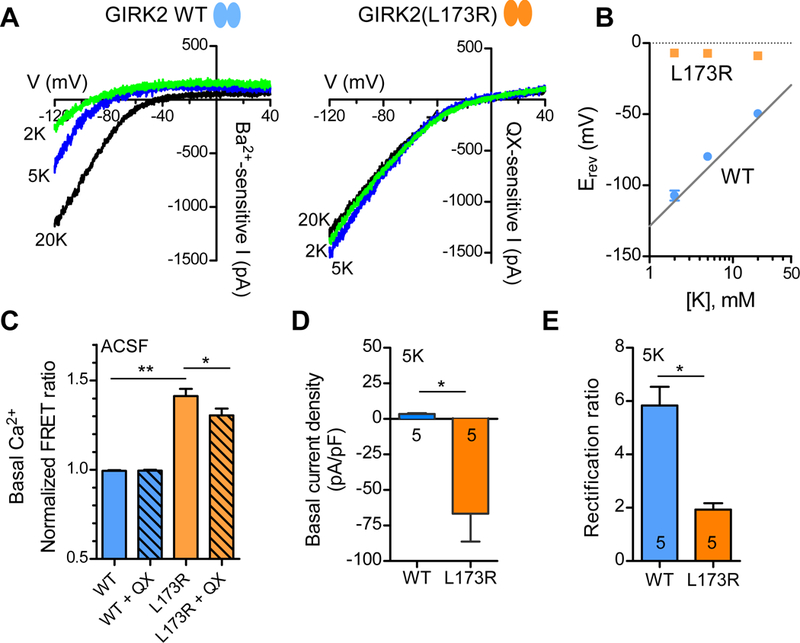
Figure 5: Altered ion selectivity of GIRK2(L173R) channels.

(A) Current-voltage plots (I-V) show Ba2+-sensitive basal currents for wild-type channels and QX-314-sensitive basal current for GIRK2(L173R) channels with ‘2K’ (green trace), ‘5K’ (blue trace), and ‘20K’ (black trace) solutions. (B) Reversal potentials for wild-type (blue circles) and mutant (orange squares) GIRK2 channels are plotted as a function of extracellular [K+] (mean ± SEM, N=5). (C) Bar graph shows normalized FRET ratio measured in a fluorometric plate reader with ACSF for wild-type and L173R channels (± SEM, N=48). QX: 100 μM QX-314 (**P < 0.001; *P < 0.05, One-way ANOVA with Tukey’s post hoc test). HEK293T cells coexpressing FRET-based Ca2+ detector, Twitch 2B. (D) Bar graph shows average basal current density for wild-type (Ba2+-sensitive) and mutant (QX-314 sensitive) channels measured at −70 mV using ‘5K’ solution (± SEM). Outward current indicated as positive number and inward current as negative number (*P < 0.01, Student’s t test). (E) Bar graph shows average rectification ratio for wild-type and mutant channels with ‘5K’ solution. Rectification ratio was calculated as inward current (−20 mV + Erev / outward current (+20 mV + Erev) (± SEM) (*P < 0.001, Student’s t test).
