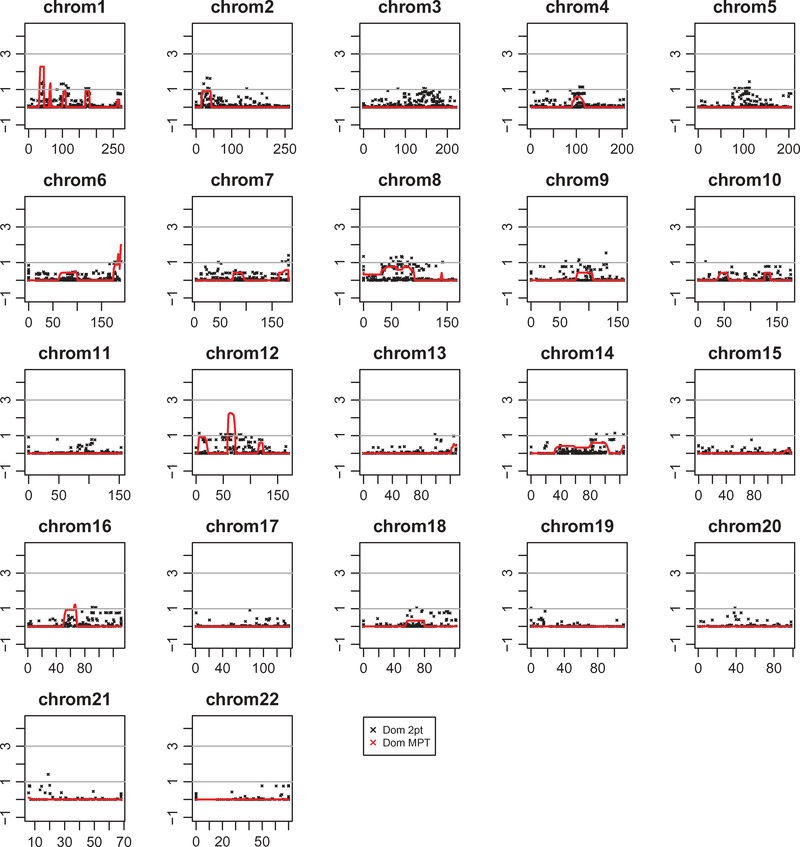
Figure 4.
Summary of two-point and multipoint linkage analyses using MERLIN. Plots of −log10 chromosome-wide significant p values (−log10P) for autosomal dominant parametric two-point and multipoint linkage analyses in 26 individuals. The maximum peak LOD scores were achieved on chromosomes 1p36.13–1p36.11 and 12q12–12q14.1. Y-axis represents −log10 ratio of the LOD score. X-axis represents chromosome position in centimorgans (cM).

