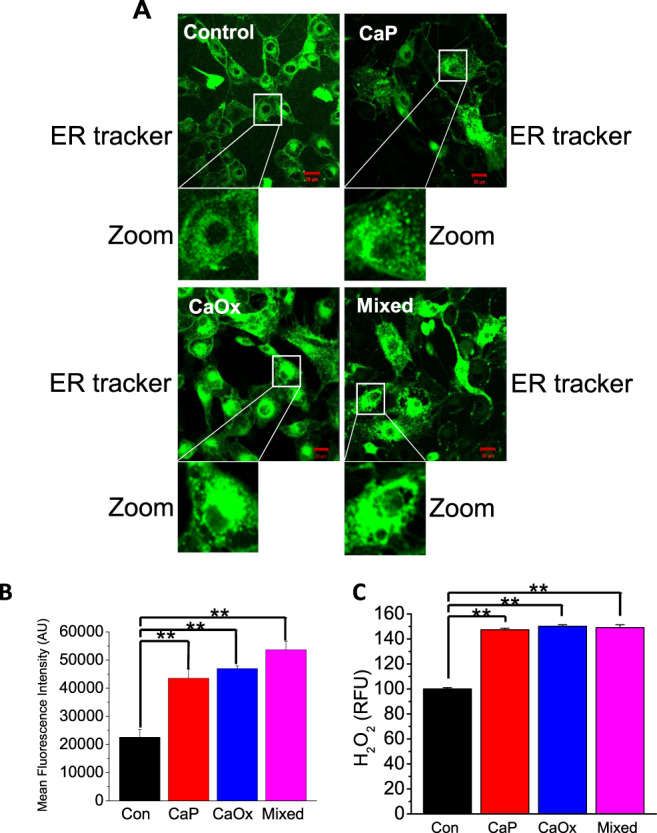
Fig. 4. Crystal internalization alters ER morphology in HK2 cells.

Control (noncrystal) CaP, CaOx, and CaP + CaOx (mixed) crystals were introduced into HK2 cells for 24 h. To determine ER subcellular localization and morphology, cells were stained with fluorescent ER tracker (green) and live-cell imaging was performed by confocal microscopy. a Representative ER staining of Control; CaP; CaOx; and Mixed crystal conditions were obtained. Images were collected with a 63× objective. b Mean fluorescence intensity was measured in six microscopic fields and quantified, intensity was quantified using ImageJ software version 1.52a (NIH); n = 6. c ER stress is associated with oxidative stress, ROS release was measured with ROS measurement kit following CaP, CaOx, and mixed crystal internalization for 24 h. Statistically significant differences are indicated (mean ± SEM). Experiments were performed in triplicates. Two-tailed t-test was used for statistical comparison in b and c. Levels of significance are indicated as *p < 0.05; **p < 0.01 as shown in the bar diagrams
