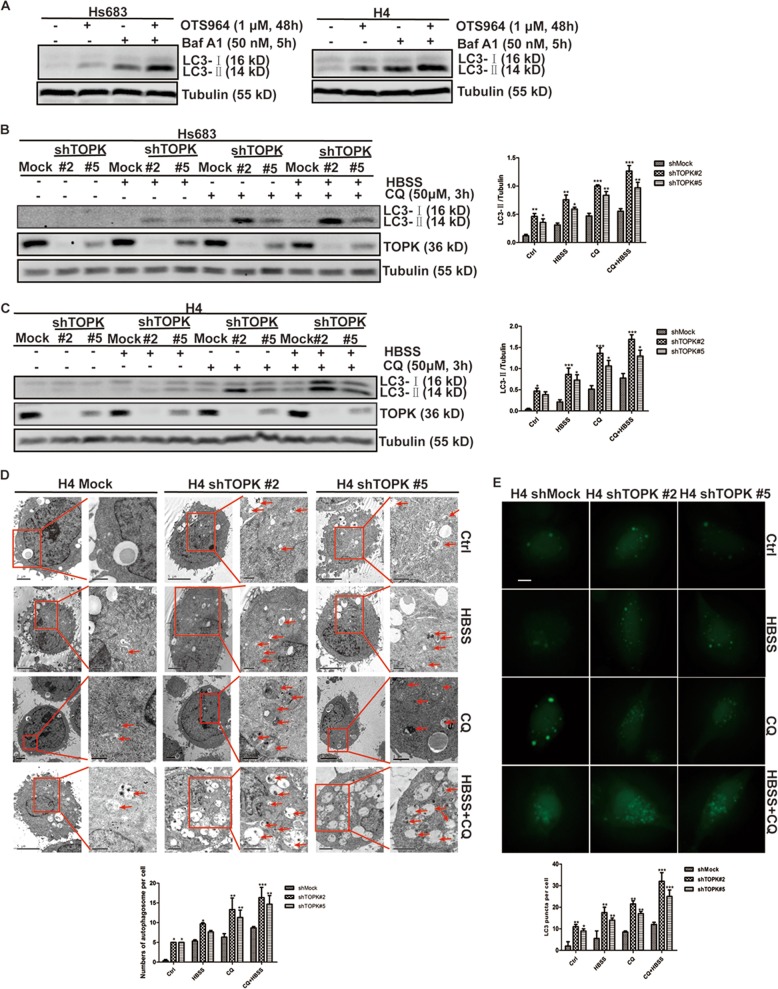
Fig. 2. TOPK inhibits autophagy initiation in glioma cells.
a Hs683 (left) and H4 (right) cells were treated with OTS964 for 48 h after seeding for 24 h. Baf A1 (50 nM) was added 5 h before the cells were harvested. Samples of whole cell lysates were analyzed by western blots using the indicated antibodies. TOPK-silencing-Hs683 b cells and TOPK-silencing-H4 c were treated with HBSS for 6 h after seeding for 24 h. CQ (50 μM) was added 3 h before the cells were harvested. Samples of whole cell lysates were analyzed by western blots using the indicated antibodies. (Fig. 2b and c, left). Data of b and c represent the results of triplicate experiments. The densities of LC3-II/Tubulin in Hs683 (Fig. 2b, right) and H4 (Fig. 2c, right) were determined by Image J. The data were presented in the form of mean ± SD, *P < 0.05, **P < 0.01, ***P < 0.001. d H4-shRNA cells were seeded onto the coverslips for 24 h, and then treated with HBSS for 6 h and CQ (50 μM) for 3 h, photographed by transmission electron microscopy (left). Low-magnification images were on the left, and high-magnification images were on the right in each group. Red arrowheads on the high-magnification images indicated autophagosomes. The numbers of autophagosome per cell were counted, and the difference was analyzed using Prism 5 software (right). The data were presented in the form of mean ± SD, *P < 0.05, **P < 0.01, ***P < 0.001. e H4-shRNA cells were seeded onto the coverslips for 24 h, and then transiently transfected with GFP-LC3 for 48 h. The cells were treated with HBSS for 6 h and CQ (50 μM) for 3 h, photographed by fluorescence microscope (top). Scale bar: 10 μm. The average number of autophagosome per cell (nine cells) were quantified manually. The data were presented in the form of mean ± SD, *P < 0.05, **P < 0.01, ***P < 0.001

