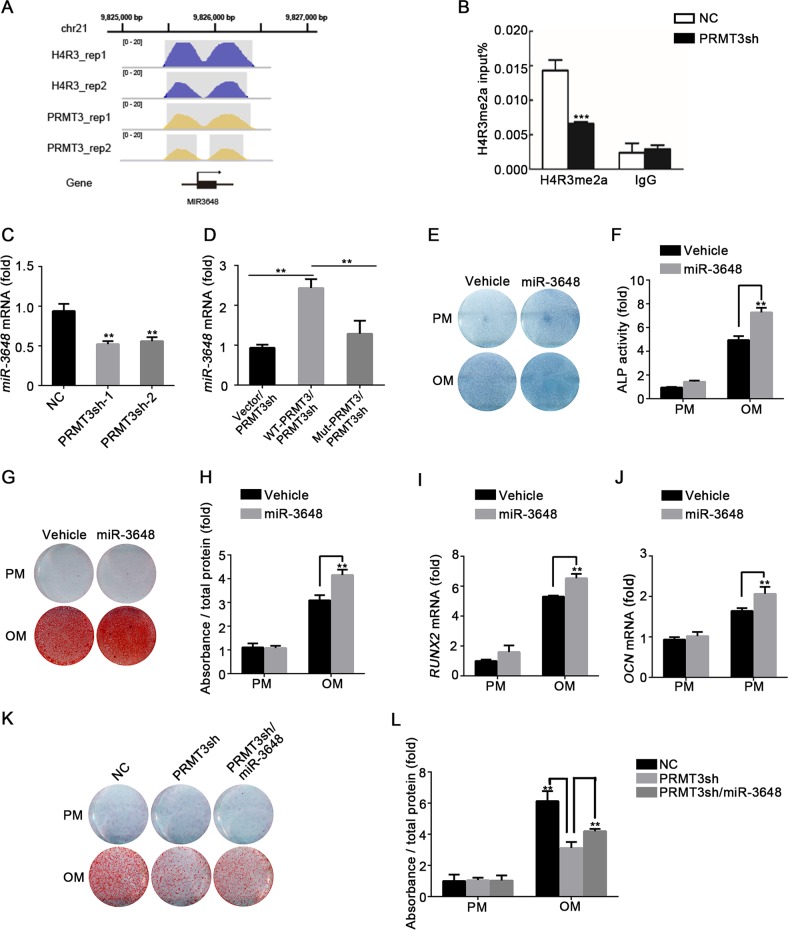
Fig. 4. PRMT3 modulates MSCs osteogenic differentiation by targeting miR-3648.
a H4R3me2a and PRMT3 signal tracks for the loci of miR-3648. The gray shaded part indicates H4R3me2a or PRMT3 enriched region obtained by peak calling. b ChIP analysis showed H4R3me2a at the promoter of miR-3648 in control and PRMT3 knockdown cells. Data are shown as mean ± SD; n = 3 independent experiments; ***P < 0.001 compared with NC by Student’s t-tests. c Relative expression level of miR-3648 in PRMT3 knockdown MSCs, as determined by qRT-PCR. Data are shown as mean ± SD; n = 3; **P < 0.01 compared with NC by Student’s t-tests. d qRT-PCR analysis of miR-3648 expression in PRMT3sh MSCs with forced expression of wild-type or mutant PRMT3. Data are shown as mean ± SD; n = 3; **P < 0.01 by Student’s t-tests. e, f ALP staining (e) and quantification (f) in miR-3648 overexpression cells on day 7 after osteogenic induction. Data are shown as mean ± SD; n = 3; **P < 0.01 by Student’s t-tests. g, h Alizarin Red S staining (g) and quantification analysis (h) in miR-3648 overexpression cells on day 14 after osteogenic induction. Data are shown as mean ± SD; n = 3; **P < 0.01 by Student’s t-tests. i, j Overexpression of miR-3648 promoted the expression of RUNX2 (i) on day 7 and OCN (j) on day 14 after osteogenic induction, as determined by qRT-PCR. Data are shown as mean ± SD; n = 3; **P < 0.01 by Student’s t-tests. k, l ARS staining (k) and quantification (l) revealed that overexpression of miR-3648 elevated the mineralized nodule formation in PRMT3 knockdown cells on day 14 after osteogenic induction. Data are shown as mean ± SD, n = 3. **P < 0.01

