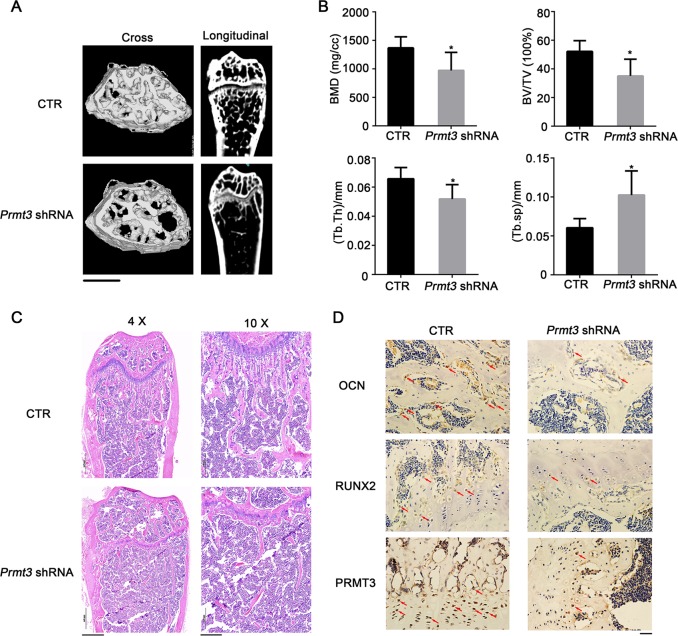
Fig. 5. Lentivirus-mediated PRMT3 downregulation leads to osteopenia phenotype in mice.
a Micro-CT image of the femurs from Prmt3 shRNA treatment mice. Scale bar: 1 mm. b Quantitative measurements of bone mineral density (BMD), bone volume/tissue volume (BV/TV), trabecular thickness (Tb.Th), and trabecular spacing (Tb.Sp). Data are shown as mean ± SD; n = 5; *P < 0.05 by Student’s t-tests. c H&E staining of femur bone sections. Scale bar for 4×: 500 μm; Scale bar for 10×: 200 μm. d IHC staining for OCN, RUNX2, and PRMT3 of bone sections from Prmt3 shRNA treatment mice. Scale bar: 20 μm. Red arrows indicate positive staining

