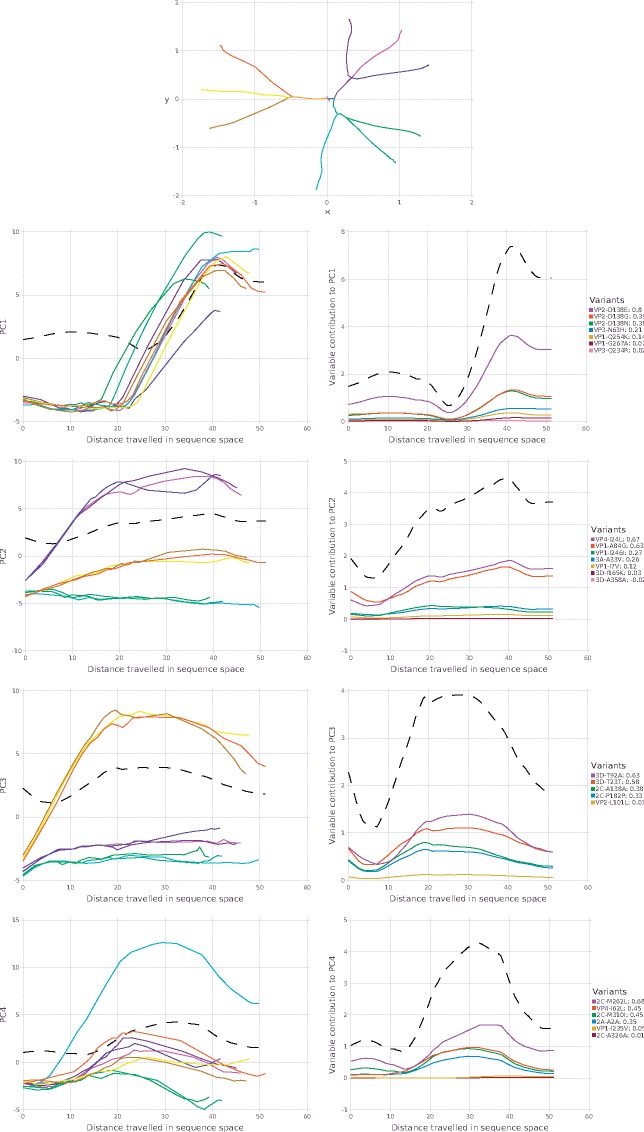
Figure 4.
Top: Overview of the evolutionary trajectories of the nine replicates in the adaptability data set (Bordería et al. 2015), shown after nonlinear dimension reduction. Wild type (WT) replicates are shown in magenta–purple colors, replicates from the high fidelity lineage in green–cyan colors and replicates from the low fidelity lineage in yellow–orange colors. The starting point in sequence space is very close for all replicates. The splits indicate when the evolutionary trajectories bifurcate, i.e. when the replicates start to deviate from each other. Left column: Principal components for replicates as a function of arc length. Right column: Variable contributions as a function of arc length. Both columns: The dotted black line shows the total contribution to at .

