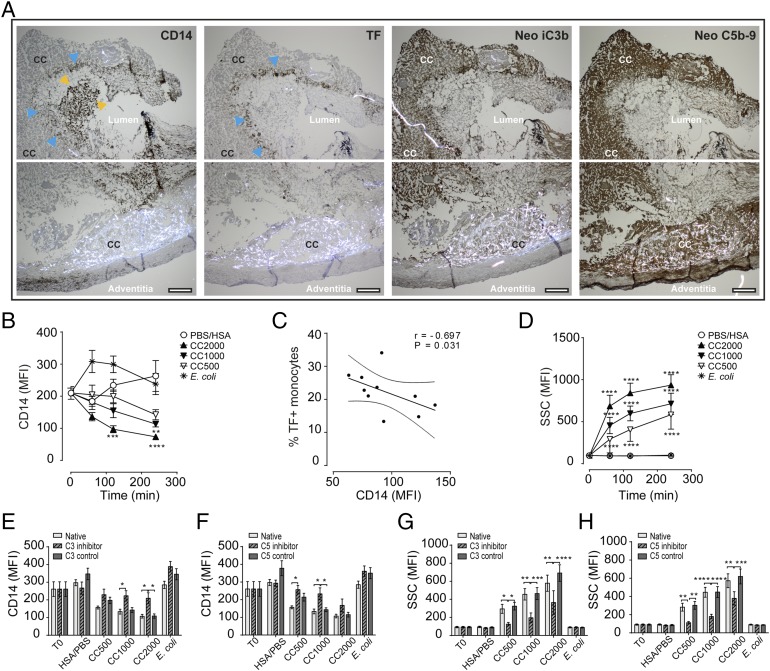
FIGURE 7.
Human vulnerable plaque and whole blood show corresponding patterns in monocyte TF/CD14 expression and complement activation to CC. (A) Immunohistochemistry of the vulnerable plaque with the monocyte marker CD14, TF, and activated complement neoepitope iC3b and neoepitopes C5b–9. Staining areas for CD14bright monocytes are marked with yellow arrows, and CD14low/TF+-expressing monocytes are marked by blue arrows; specified also are the CC-rich areas, lumen, and adventitia. Sections are 4 μm and are taken by original magnification ×4 objective and given for two adjacent areas in each staining. Scale bar, 200 μm. Whole blood following CC exposure showing effects on (B) monocyte CD14 expression, (C) correlation between CD14 and TF in monocytes, (D) the increase in monocyte granularity, (E) monocyte CD14 following inhibition of complement C3 (120 min), (F) monocyte CD14 following inhibition of complement C5 (120 min), (G) monocyte granularity following inhibition of C3 (120 min), and (H) monocyte granularity following inhibition of C5 (120 min). Data are given as mean fluorescence intensity (MFI; mean ± SEM, n = 6 donors). *p < 0.05, **p < 0.01, ***p < 0.001, ****p < 0.0001.

