FIGURE 3.
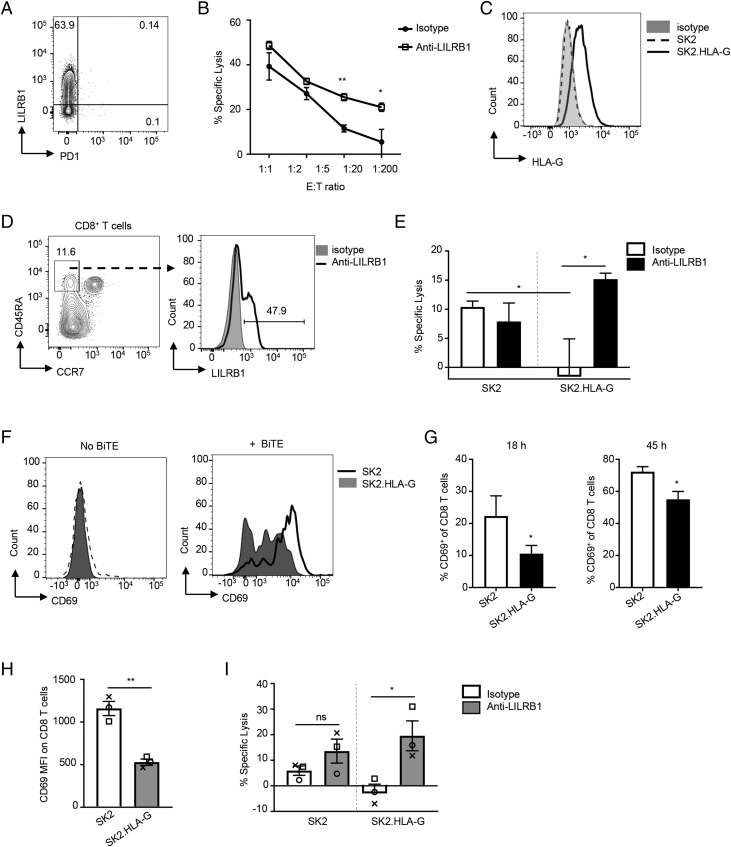
LILRB1 inhibits cytotoxic CD8+ T cell effector function in vitro. (A) Representative dot plot shows LILRB1 expression on expanded Mel-13 cytolytic CD8+ T cells. (B) In vitro Ag-specific CTL cytotoxicity assay with expanded Mel-13 cytolytic CD8+ T cells as effector cells and SK5 cells as target cells. Indicated ratio of effector cells and target cells were coincubated for 20 h in the presence of anti-LILRB1 blocking Ab (open squares) or isotype control Ab (filled circles). Results shown as mean ± SD of triplicate wells for each indicated ratio, and data are a representative of three independent experiments. (C) Representative histogram for HLA-G expression on SK2 cells (dotted line) and HLA-G–transfected SK2 cells (SK2.HLA-G, solid line) analyzed by FACS. Gray-filled histogram represents isotype control. (D) Representative FACS plots to show gating strategy for CD8+ TEMRA sorting from healthy donor PBMCs (left panel) and LILRB1 expression on sorted TEMRA (right panel). (E) BiTE molecule–mediated cytotoxicity of isolated CD8+ TEMRA to indicated target cells in the presence of anti-LILRB1 blocking Ab (filled bars) or isotype control Ab (open bars). T cell and tumor cell coculture with no BiTE Ab construct was used as baseline for specific lysis calculation. Results shown as mean ± SEM of T cells isolated from three donors (n = 3). (F) Representative histograms for CD69 expression on TEMRA cocultured with SK2 cells (line histograms) or SK2.HLA-G cells (gray-filled histograms) for 45 h in the presence of 0.4 nM BiTE molecule (right panel) or without BiTE molecule (left panel). (G) Isolated CD8+ TEMRA were cocultured with indicated tumor cells for 18 (left panel) or 45 h (right panel) in the presence of 0.4 nM BiTE molecule. Percentage of CD69+ cells (mean ± SD) were determined by FACS analysis. Data are representative of three independent experiments with two individual donors as T cell source. (H) Isolated tumor-associated CD8+ T cells were added to SK2 or SK2.HLA-G cells and treated with a MART-1–specific BiTE molecule for 45 h. Expression of CD69 measured as mean florescence intensity (MFI) on CD8+ T cells was determined by FACS analysis. Each type of symbol represents data obtained from an individual donor with mean ± SEM shown. (I) BiTE molecule–mediated cytotoxicity of isolated tumor CD8+ T cells to indicated target cells in the presence of anti-LILRB1 blocking Ab (gray-filled bars) or isotype control Ab (open bars). Each type of symbol represents data obtained from an individual donor with mean ± SEM shown. *p < 0.05, **p < 0.01, paired Student t test. ns, not significant.

