FIGURE 4.
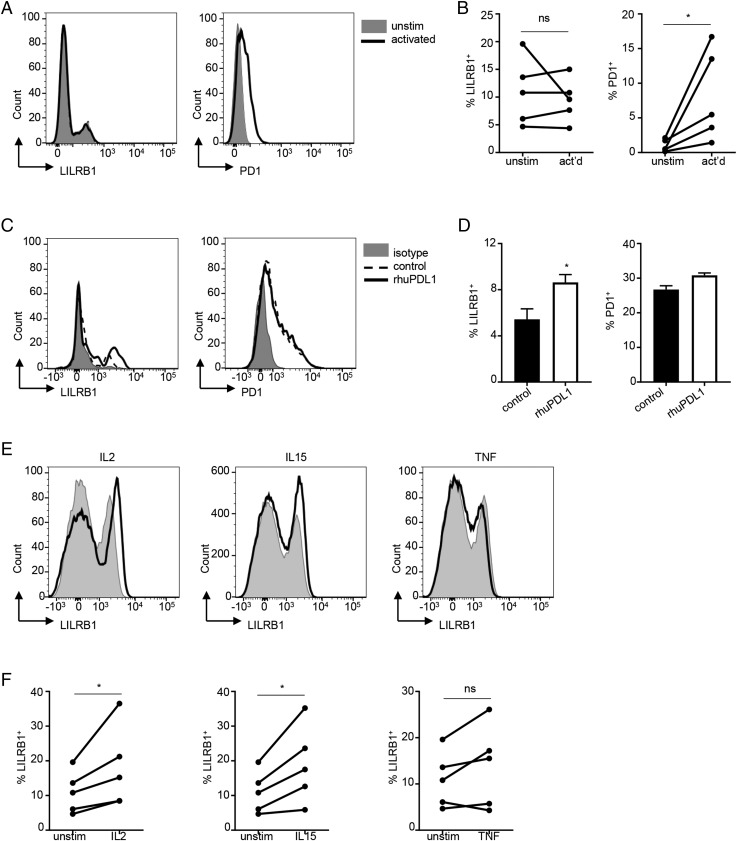
LILRB1 expression on CD8+ T cell surface is upregulated by effector cytokines and anti-PD1 blockade. (A) FACS analysis of LILRB1 (left panel) and PD1 (right panel) expression on the surface of CD8+ T cells upon TCR activation (solid lines). Gray-filled histograms are control CD8+ T cells without stimulation. (B) Quantitation of the results from (A) across multiple donors (n = 5). (C) Purified human CD8+ TEM cells were activated with anti-CD3 plus anti-CD28 in the presence of 10 μg/ml recombinant human PDL1 (rhuPDL1, solid lines) or human IgG1 (control, dashed lines). After 48 h, LILRB1 (left panel) and PD1 (right panel) expression was determined by FACS analysis. Gray-filled histograms are isotype staining controls. (D) Quantitation results of (C) across multiple donors (n = 3). Representative data shown as mean ± SD. (E) Human PBMCs were stimulated with rIL-2, IL-15, or TNF for 48 h (solid lines) and subjected to FACS analysis. Gray-filled histograms represent CD8+ T cells gated from unstimulated PBMCs. (F) Quantitation of (E) across multiple donors (n = 5). *p < 0.05, Student t test. ns, not significant.

