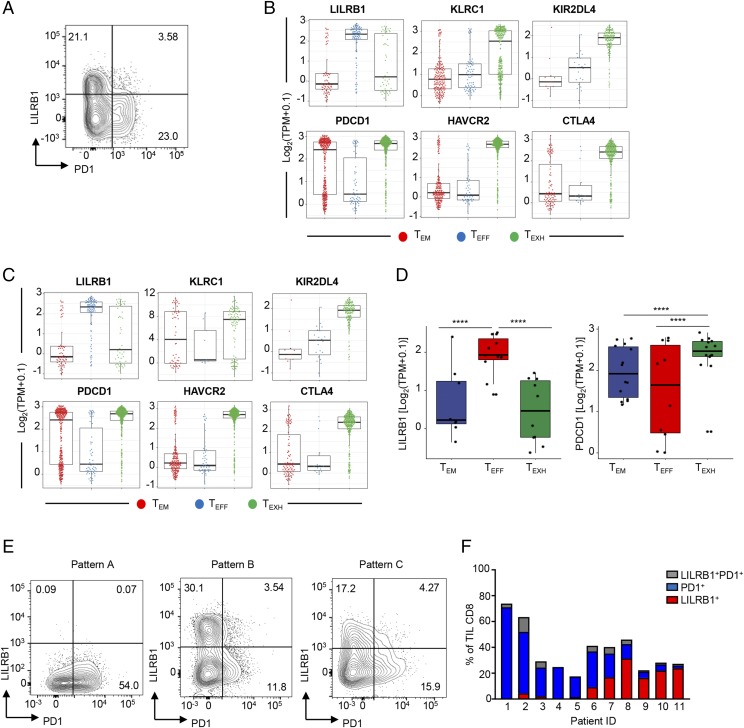
FIGURE 5.
LILRB1 and PD1 are expressed by distinct CD8+ T cell subsets in tumor. (A) Representative FACS plot to show LILRB1 and PD1 expression on TCR-activated human CD8+ T cells. Percentage of cells in each quadrant is indicated. (B and C) Single-cell RNAseq swarm plots showing the expression of indicated genes in tumor-infiltrated CD8+ T cell clusters isolated from NSCLC (B) or hepatocellular carcinoma (C). (D) Boxplots of LILRB1 and PD1 gene expression in tumor-infiltrated CD8+ T cell clusters from NSCLC patients. Each dot represents average gene expression from a given patient. ****p < 0.0001, paired Student t test. (E) Representative FACS plots to show LILRB1 and PD1 expression on tumor-infiltrating CD8+ T cells. Numbers represent percentage of cells in a given quadrant. (F) Quantitation of (E) from 11 NSCLC tumor patients. Percentage of total tumor CD8+ T cells expressing LILRB1 (in red), PD1 (in blue), or both (in gray) in each tumor.

