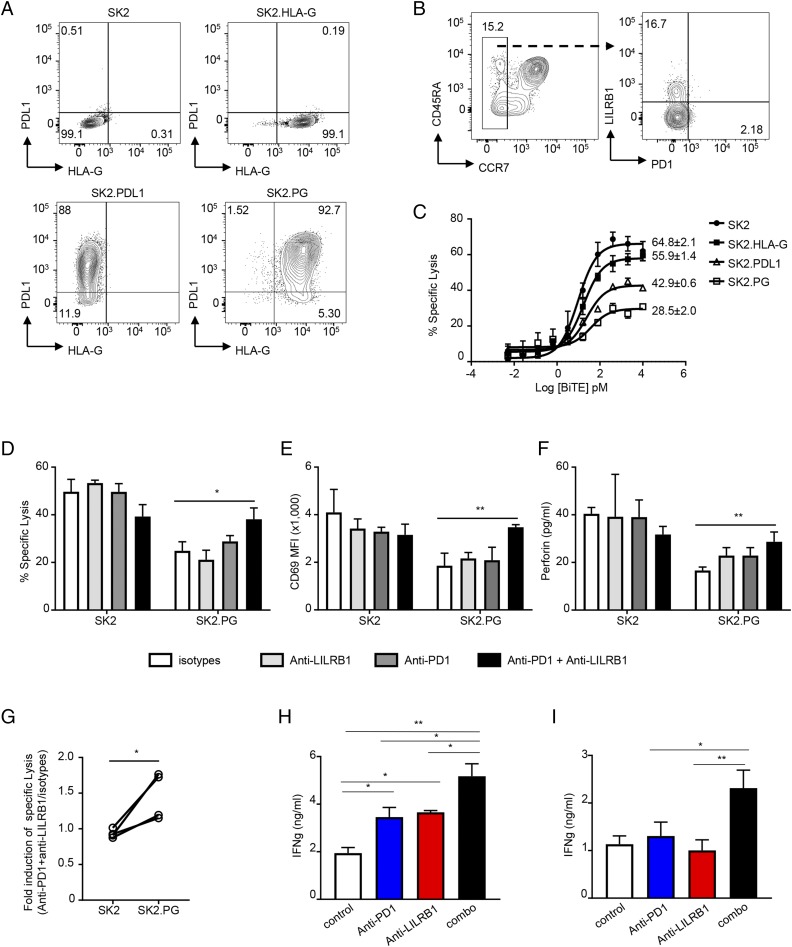
FIGURE 6.
Anti-LILRB1 synergize with anti-PD1 to promote CD8+ T cell effector function. (A) Dot plots to show HLA-G and PDL1 expression on established tumor cells lines. (B) Representative FACS plots to show gating strategy for CCR7− CD8+ T cell sorting from healthy donor PBMCs (left panel) and LILRB1 and PD1 expression on sorted CCR7− CD8+ T cells (right panel). (C) Sorted CCR7− CD8+ T cells were incubated with indicated tumor cells in the presence of indicated amount of MART-1–specific BiTE molecule. Specific cytotoxicity was determined after 45 h. Results shown as mean ± SD from triplicated wells and are a representative from three independent experiments using two healthy donors as the source of CD8+ T cells. Numbers are maximum percentage of specific lysis. (D–F) BiTE molecule–mediated cytotoxicity of isolated CCR7− CD8+ T cells to indicated target cells in the presence of anti-LILRB1 blocking Ab (light gray bars), anti-PD1 blocking Ab (dark gray bars), combination of anti-LILRB1 and anti-PD1 (black bars), or isotype control Ab (open bars). T cell and tumor cells coculture with no BiTE Ab construct was used as baseline for specific lysis calculation. Percentage of specific lysis (D), T cell activation represented by CD69 upregulation measured by FACS (E), and perforin production by Luminex (F) was determined and plotted. Results shown as mean ± SD of triplicated wells. Data are a representative of three independent experiments using T cells isolated from two donors. (G) Quantitation of anti-LILRB1 plus anti-PD1 in promoting CCR7− CD8+ T cell cytolytic activity. Each dot represents data obtained from an individual donor. *p < 0.05, paired Student t test. (H and I) Isolated total T cells were cocultured with allogeneic CD11c+ cells in the presence of indicated Abs. After 5 d, culture supernatants were collected, and IFN-γ levels were determined by ELISA. Data are plotted as mean ± SD. Results is representative of three independent experiments with T cells from two individual donors and CD11c+ cells from three individual donors. *p < 0.05, **p < 0.01, Student t test.

