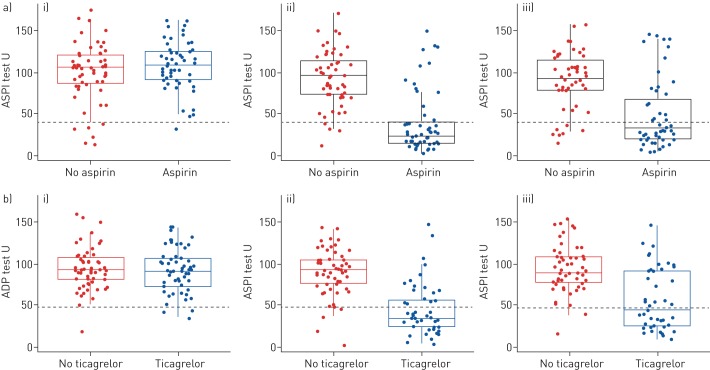
FIGURE 2.
Primary outcome measure intention-to-treat (ITT) analysis. Boxplots of the a) ASPI test split by no-aspirin and aspirin comparative groups over time; b) adenosine diphosphate (ADP) test split by no-ticagrelor and ticagrelor comparative groups over time (ITT analysis set). i) Baseline; ii) 1 month; iii) 6 months. The green dashed line indicates the threshold below which patients are considered to be responders.

