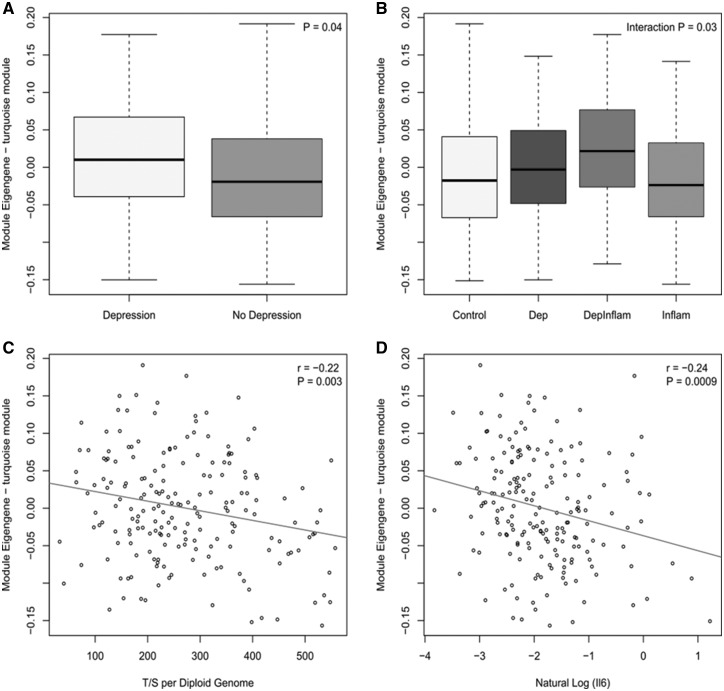
Figure 4.
Boxplots and scatterplots of Module Eigengene (ME) against (A) diagnosis (depression versus no depression), (B) group [Depression (Dep), history of depression and inflammatory disorder only (DepInflam), history of inflammatory disorder only (Inflam), healthy control (Control)], (C) Telomere length (T/S per diploid genome) and (D) natural log of IL-6 serum levels.

