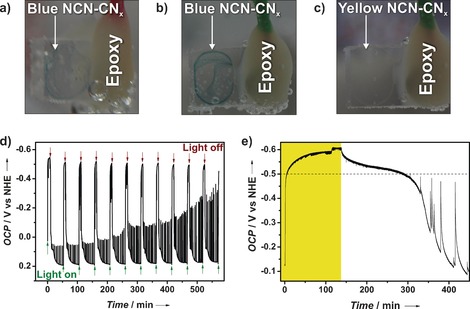
Figure 3.

Photographs of NCN‐CNx drop‐cast on FTO: a) blue state after illumination in the presence of 4‐MBA; b) blue state after charging by applying −530 mV versus NHE in the dark, and c) the original state after de‐charging by applying 0 V versus NHE. Photoelectrochemical measurements of electrodes of NCN‐CNx on FTO: d) OCP monitored under continuous chopped light, showing reproducible excitation of the blue state at about −500 mV versus NHE. The spikes during the decay after illumination arise from current peaks of NCN‐CNx particles that are in weak electrical contact with FTO and are decharged with a time delay when the potential difference is sufficiently large. e) Effect of longer illumination time in the presence of sodium citrate as electron donor (period of illumination highlighted in yellow). The population of even higher electronic states occurs slowly but continuously as shown in the region above the dashed line.
