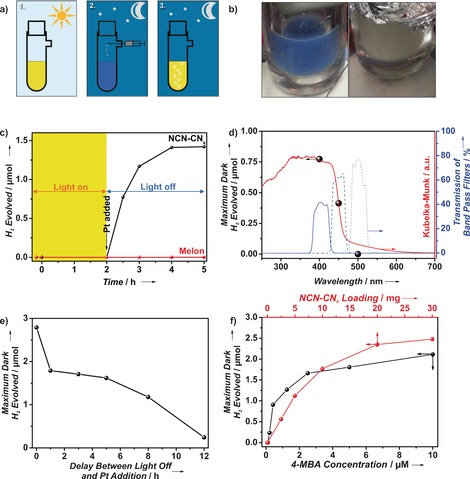
Figure 4.

a) Schematic summary of the dark hydrogen evolution process: 1. Irradiation of the NCN‐CNx suspension to form the blue radical state; 2. Addition of a solution of hydrogen evolution co‐catalyst under oxygen‐free transfer in the dark, and 3. Evolution of hydrogen with the concomitant reversal of suspension color. b) Photographs of the “blue radical” (left) and its color reversal subsequent to dark hydrogen evolution (right). c) Plot illustrating the process of dark hydrogen evolution as a function of time, in which the region highlighted in yellow corresponds to the period of irradiation. d) Wavelength dependence on maximum dark hydrogen evolved (black spheres) overlaid on the diffuse reflectance UV/Vis spectrum of the NCN‐CNx (red line) and the transmission spectra of the filters used (blue lines; 400 nm solid, 450 nm dashed, 500 nm dotted). e) Maximum dark hydrogen evolved as a function of the time between switching off the light and injection of the Pt colloid. f) Maximum dark hydrogen evolved versus NCN‐CNx loading and 4‐MBA concentration.
