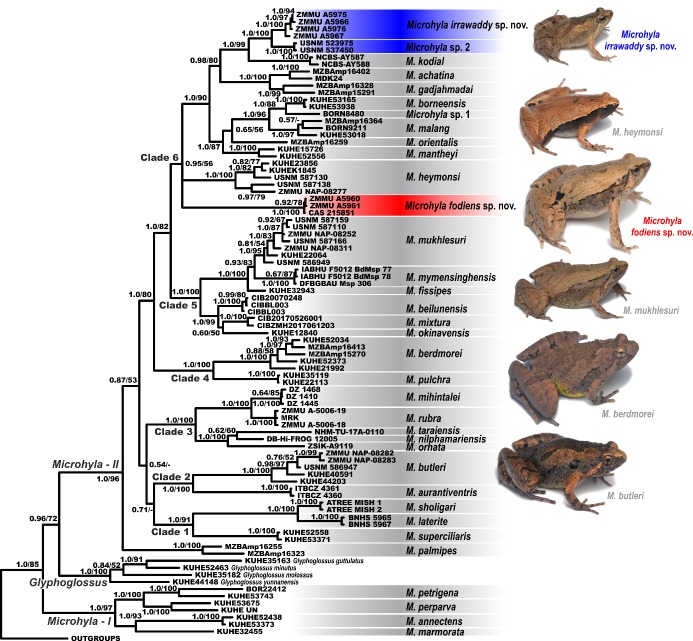
Figure 3. Bayesian inference tree of Microhyla derived from analysis of 2 481 bp long alignment of 12S rRNA, tRNAVal, and 16S rRNA gene fragments.
For voucher specimen information and GenBank accession Nos. see Table 1. Red and blue denote new species of Microhyla from Myanmar (see Figure 1). Numbers at tree nodes correspond to BI PP/ML BS support values, respectively. Outgroup taxa not shown. Photos showing six species of Microhyla recorded from Myanmar taken by Nikolay A. Poyarkov.

