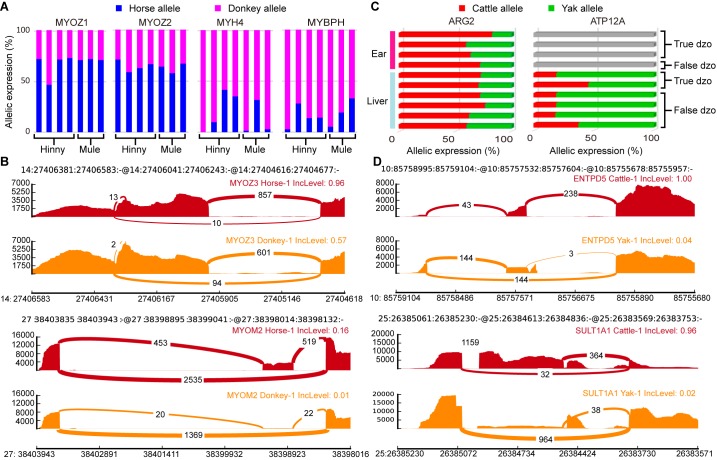
Figure 6. Functional analysis of genes showing ASE and ASS.
A: Allelic expression ratios of four muscle function-related ASE genes, MYOZ1, MYOZ2, MYH4, and MYBPH, in mule/hinny muscle samples. Horse allele (blue); donkey allele (purple). B: Sashimi plot of muscle-related genes showing ASS, MYOZ3, and MYOM2, in mule/hinny muscle samples. Read densities supporting inclusion and exclusion of exons are shown. C: Proportion of ARG2 and ATP12A expression levels from cattle allele (red) or yak allele (green) in four liver and six ears samples of dzo. Gray bar indicates no expression. D: Sashimi plot of two genes showing ASS (ENTPD5 and SULT1A1) in dzo. Read densities supporting inclusion and exclusion of exons are shown.

