
Figure 4.
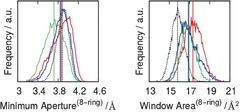
Histograms of the minimum aperture of 8‐MRs (left) and window area of the 8‐MRs (right), obtained from the AIMD simulations. Color code: S0 dashed black, S1 red, S2 green, and S3 blue. Vertical lines show the corresponding values for rigid models.