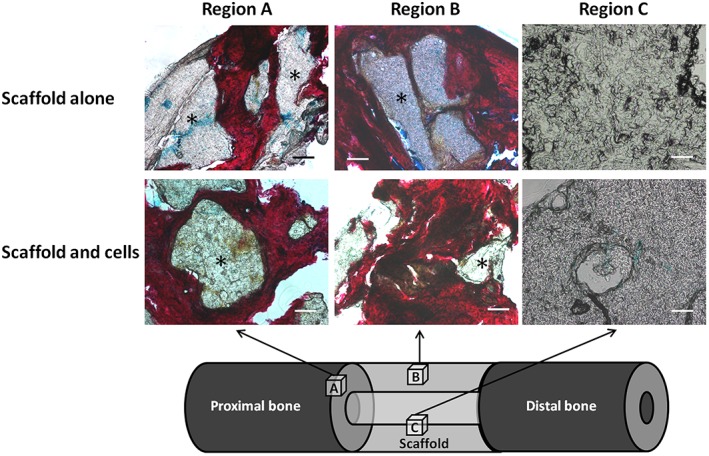
Figure 12.

A/S histological analysis of the ovine segmental tibial defect model after 12 weeks in vivo incubation. Only the scaffold groups are displayed, as insufficient tissue was formed within the empty defects. In region A (bone–scaffold interface), there was significant infiltration of new tissue into the scaffold, as demonstrated by red staining of collagen type I. In region B (near the surface of the mid‐section of the scaffold), new osseous tissue was seen in both scaffold groups, with deep penetration of tissue into the porous network. Region C (within the inner face of the scaffold mid‐section) showed no new osseous tissue formation in either scaffold group; the polymer in this region remained intact, with some surrounding cells but no new bone formation; *polymer; scale bars = 100 µm. [Colour figure can be viewed at wileyonlinelibrary.com]
