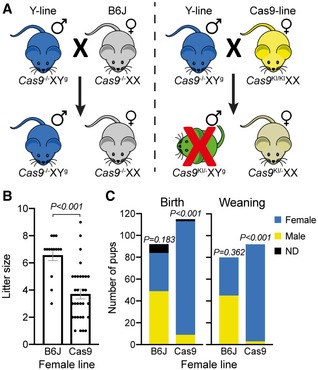
Figure 1. Biasing the sex ratio in mice.

- The crosses between the Y‐line males (blue) with B6J females (gray) are illustrated on the top left and those of the Y‐line males with Cas9‐line females (yellow) on the top right. The presence or absence of the Cas9 allele is annotated as Cas9 KI or Cas9 −, respectively, whereas the Y‐linked gRNA allele is annotated as Yg. The X chromosome is unmodified in all instances.
- Litter size of the crosses of the Y‐line males with the B6J‐ (n = 14) or Cas9‐ (n = 31) line females. Dots represent individual litter size, and bars represent average litter size ± SD. Significance was determined using a two‐tailed unpaired parametric t‐test.
- Pie charts of the sex distribution of the total pups from the crosses of the Y‐line males with the indicated female line at day of birth and at weaning. Significance was determined using a two‐tailed binomial test, assuming equal male‐to‐female ratio.
