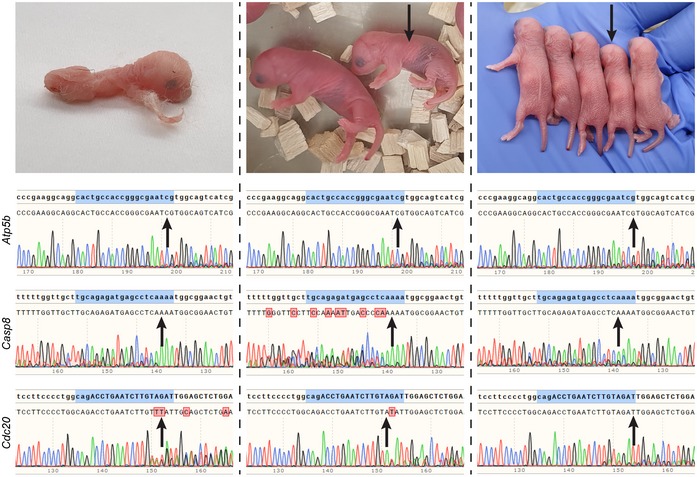
Figure 2. Disruption of male gene targets by the genetic system.

Pictures of a deformed (top left) and of small males (arrowed, top center and right) born from a cross between the Y‐line males and the Cas9‐line females. These males died within 3 days from birth. Below each picture are chromatograms of Sanger DNA sequencing of the indicated PCR amplified genes from samples of these males taken at birth. Targeted regions homologous to the gRNAs are highlighted in blue. Red boxes represent deviations between the expected and observed sequences. Arrows point to indel locations (P < 0.001, two‐tailed t‐test of the variance–covariance matrix of the standard errors), as determined by Tracking of Indels by Decomposition 27.
