Figure 1.

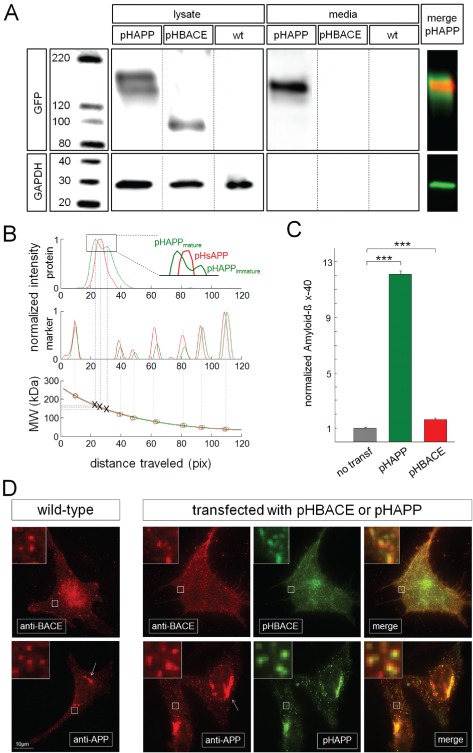
pHAPP and pHBACE are processed, transported and localized similarly to their endogenous counterparts APP and BACE. A) Western blots of the lysates and media of cells cultured for 48 h and transfected with pHAPP or pHBACE or untransfected (wt). An immunoblot of a pHAPP‐transfected cell lysate displayed an ∼170 kDa band, corresponding to mature pHAPP, and an ∼140 kDa band, corresponding to immature pHAPP. For the pHBACE‐transfected cell lysates, an ∼80 kDa band corresponding to pHBACE was detected. The loading control (GAPDH) was detected in all cells. An ∼155 kDa band, corresponding to pHsAPP, was detected in the pHAPP cell media. The images of the blots of pHAPP in the lysate (green) and the media (red) are merged. B) Western blot intensity profiles of the bands and molecular weight markers in the pHAPP‐transfected cell lysate (green) and media (red) according to the distance traveled. The bottom graph shows the plotted and interpolated molecular weight marker bands according to their associated molecular weights. Based on this interpolated curve, the exact molecular weights of mature pHAPP (168.6 kDa), immature pHAPP (144.1 kDa) and pHsAPP (158.9 kDa) were determined. C) The normalized (1 = 10.81 pg/mL) concentration of Aβx–40 in the cultured HeLa cell media at 48 h. The Aβx–40 concentrations in untransfected controls and pHAPP‐ or pHBACE‐transfected cells, respectively, are depicted. These measurements were performed via particle sorting‐based multiplexing. Overexpression of either protein caused a significant increase in the Aβx–40 concentration compared to non‐transfection [Aβx–40untransfected = 10.81 pg/mL (±0.50 pg/mL), Aβx–40pHAPP = 134.73 pg/mL (±2.52 pg/mL), Aβx–40pHBACE = 17.62 pg/mL (±0.84 pg/mL); p TTEST(pHAPP) = 9.0 × 10⁻¹¹, p TTEST(pHBACE) = 1.9 × 10⁻⁵, N = 8]. D) Representative immunocytochemistry images of untransfected and pHAPP‐ or pHBACE‐transfected HeLa cells labeled using an anti‐BACE or anti‐APP antibody, respectively. The cells were imaged via TIRF microscopy. APP and BACE were predominantly detected as clusters in both the untransfected and transfected cells, as shown in greater detail in the insets. The number of clusters per 3 µm‐sided square was not significantly different between the transfected and untransfected cells [numberwtAPP = 5.85 (±0.45), numberpHAPP = 5.25 (±0.22), p TTEST(APP) = 0.19; numberwtBACE = 5.96 (±0.68), numberpHBACE = 6.24 (±0.65), p TTEST(BACE) = 0.40; N = 5]. Examples of the colocalization of immunolabeling and transfected expression protein fluorescence are shown in the insets [Mander's overlappHBACE = 0.97 (±0.01), Mander's overlappHAPP = 0.97 (±0.01); N > 3]. The arrows indicate the annular accumulation of APP.
