
Figure 2.
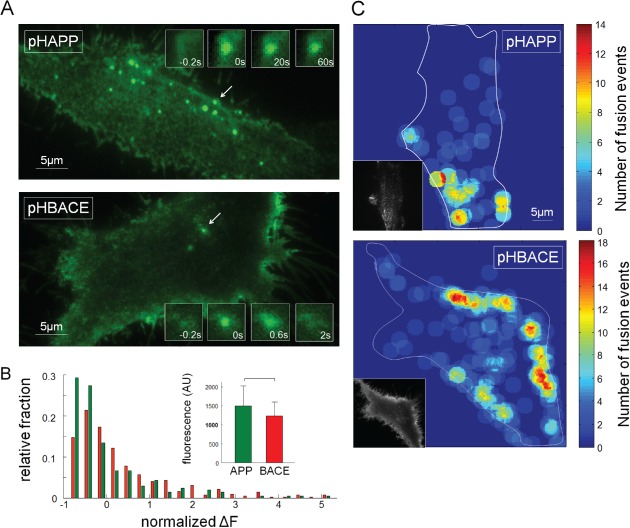
Exocytosis of pHAPP and pHBACE is clearly visualized via TIRF microscopy. A) HeLa cells transfected with pHAPP or pHBACE were imaged via TIRF microscopy over a 1‐min period at a frame rate of 5 Hz. Representative images of pHAPP and pHBACE from the image stacks are shown. The exocytosis of vesicles containing pHAPP or pHBACE appeared in the form of spontaneous, restricted increases in fluorescence. The arrows indicate characteristic fusion events, which are shown at the indicated time points (insets). B) The distribution of the amplitudes of the fluorescence increases that were observed for the pHAPP and pHBACE fusion events and the mean amplitudes (inset) (p rank sum = 0.29, N = 10). The increases in fluorescence were normalized to the corresponding average value for comparison. C) Local distribution of fusion events within a 1‐min period (r circles = 2.0 µm). The exocytosis sites were not randomly distributed, but multiple vesicles fused in succession at the same site or in close proximity. To identify the location of the fusion events with respect to the cell structure, the contour of each cell was delineated in each image. TIRF images of each cell are shown in the insets.