Figure 5.

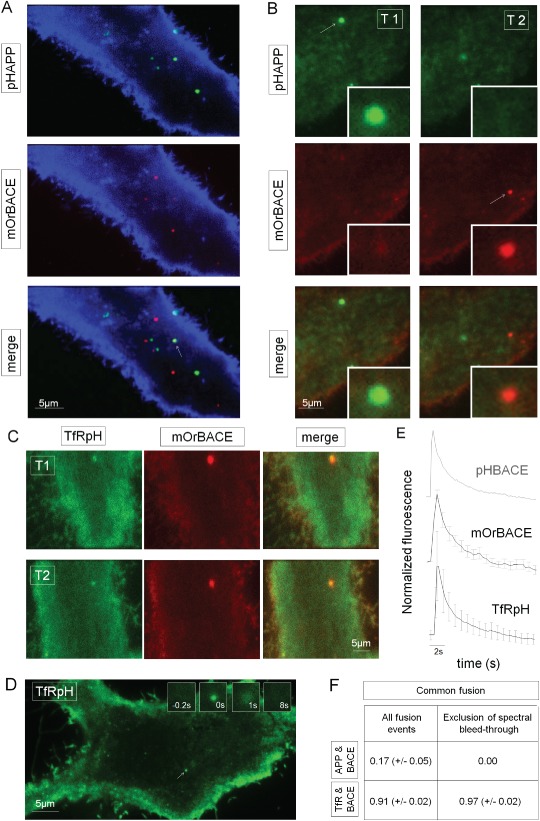
pHAPP and pHBACE are exocytosed in spatially and temporally distinct manners. A) Maximum intensity projection of the difference images of a HeLa cell co‐transfected with pHAPP (green) and mOrBACE (red). The cells were simultaneously imaged in two fluorescence channels for a period of 1 min via TIRF microscopy. The minimum projection of mOrBACE (blue colored) was used to visualize the cell. B) The arrows show pHAPP and mOrBACE fusion events at different time points (T1 and T2, respectively). C) Fusion events in a representative HeLa cell co‐transfected with TfRpH and pHBACE. The exocytosis of TfRpH colocalized with that of mOrBACE. D) Representative TIRF image of a HeLa cell transfected with TfRpH. The arrow indicates the fusion event whose appearance at different time points is shown in the insets. E) Normalized average fluorescence profiles of TfRpH (n > 40) and mOrangeBACE (n > 15) fusion events. For comparison, the normalized average fluorescence profile of pHBACE from Figure 2A is shown in gray. pHBACE, mOrBACE and TfRpH displayed the same exocytosis kinetics [τ pHBACE = 2.28 seconds (±0.48), τ mOrBACE = 2.08 seconds (±0.74), τ TfRpH = 2.77 seconds (±0.29); Kruskal–Wallis test: χ 2 2,27 = 1.37, p = 0.50; n = 10]. F) Table showing the spatially and temporally overlapping fusion events for pHAPP and pHBACE and for TfRpH and pHBACE (N > 10). Spectral bleed‐through was excluded by analyzing only the fusion events that were initially detected using the mOr channel.
