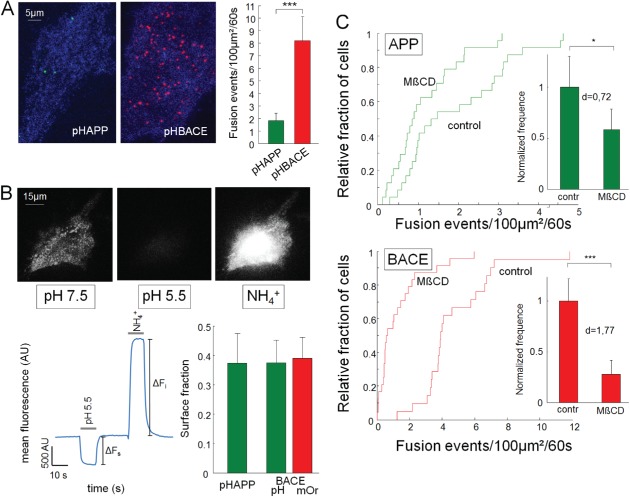
Figure 6.

The numbers of pHAPP and pHBACE fusion events are distinct and pharmacologically alterable. A) Maximum intensity projection of the difference images of HeLa cells transfected with pHAPP or pHBACE. The cells were imaged for a 1‐min period at a frame rate of 5 Hz via TIRF microscopy. Minimum intensity projections (blue) were used to visualize the cells. Bar graphs depicting the mean number of fusion events per 100 µm2 within a 1‐min period (p rank sum = 1.9 × 10⁻⁷, N > 20). B) HeLa cells transfected with pHAPP or pHBACE were perfused with a pH 7.5 extracellular solution. The perfusate was then converted to a pH 5.5 solution and finally converted to a solution containing NH4 + for 10 seconds during epifluorescence imaging. The fluorescence profile shows the mean fluorescence of a representative cell. The acidic and ammonium pulses and the amplitudes of ΔF s and ΔF i are included. The bar graphs show the resulting surface fractions of pHAPP, pHBACE and mOrBACE (p TTEST(pHAPP,pHBACE) = 0.50; p TTEST(pHBACE,mOrBACE) = 0.40; n > 15). C) The cumulative density functions of the number of fusion events in the untreated (control) and MβCD‐treated cells (N > 20). The bar graphs show the normalized mean number of fusion events per 100 µm2 of untreated (control) and MβCD‐treated cells within a 1‐min period (pHAPP: p rank sum test = 0.02, d Cohens = 0.72; pHBACE: p rank sum test = 1.7 × 10⁻⁶, d Cohens = 1.77; N > 20). The results are provided for pHAPP‐ and pHBACE‐transfected HeLa cells.
