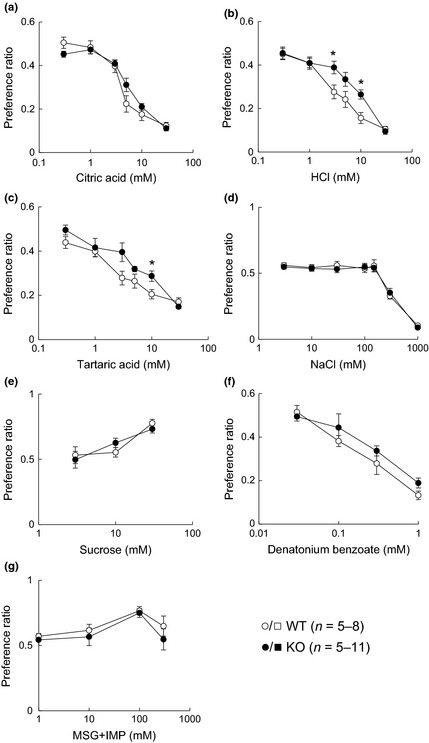
Figure 4.

Taste preferences of wild‐type (WT) and CPLX2‐knockout (KO) mice for different tastants in 48‐h two‐bottle preference tests. Preference ratios for (a) citric acid, (b) HCl, (c) tartaric acid, (d) NaCl, (e) sucrose, (f) denatonium benzoate, and (g) monosodium glutamate (MSG)+IMP. *p < 0.05 (t‐test).
