
Figure 1.
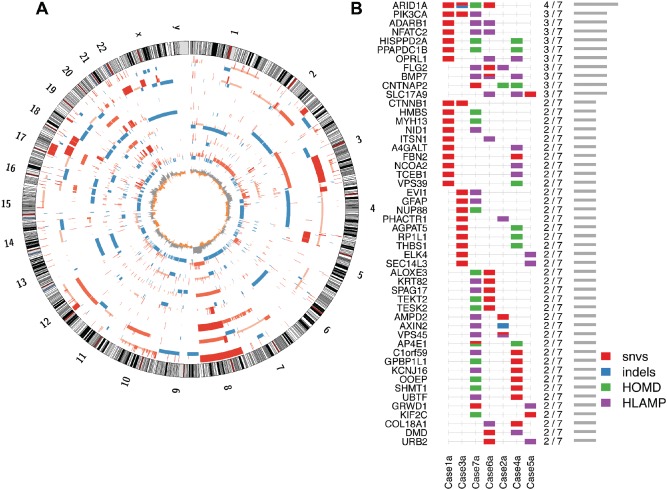
Overview of somatic genomic architecture and mutational pattern across sampled CCC tumours. (A) Circos plot, showing somatic DNA copy number gains (red) and losses (blue) in each CCC primary tumour, in order from the outermost ring (cases 1–7): bar heights indicate relative gains or losses, eg higher red bars indicate high‐level amplification, short blue bars indicate heterozygous deletions and the innermost ring shows the frequency of the gains (grey) and losses (orange) among the seven cases. (B) Genes most frequently affected by a somatic INDEL, SNV or extreme copy number event [homozygous deletion (HOMD) or high‐level amplification (HLAMP)]: at least one known somatic truncating variant in ARID1A is not illustrated here, as it was not found in whole‐genome data, neither was it able to be validated in our deep‐sequencing assay (case 4; see supplementary material, Figure S1), due to low coverage, likely related to high GC content