
Figure 2.
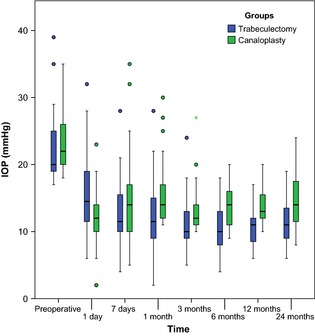
Intraocular pressure (IOP) results for canaloplasty and trabeculectomy. IOP significantly dropped to a lower level during follow‐up in both groups (p < 0.001). Overall, IOP was significantly lower in patients undergoing trabeculectomy. Box plots illustrate the median (50th percentile) as a black centre line and the 25th and 75th percentile as the lower and upper hinges of the box, 1.5 IQR as the upper and lower bards. Circles represent minor outliers.