
Figure 1.
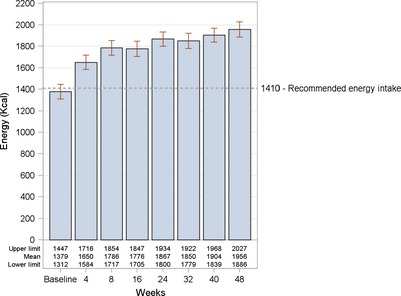
Mean energy intake at baseline and each post‐baseline visit. P < 0.0001 for each post‐baseline visit compared to baseline. The P‐value is from a signed rank test when controlling for the total number of seven comparisons using stepdown Bonferroni adjustment.