
Figure 2.
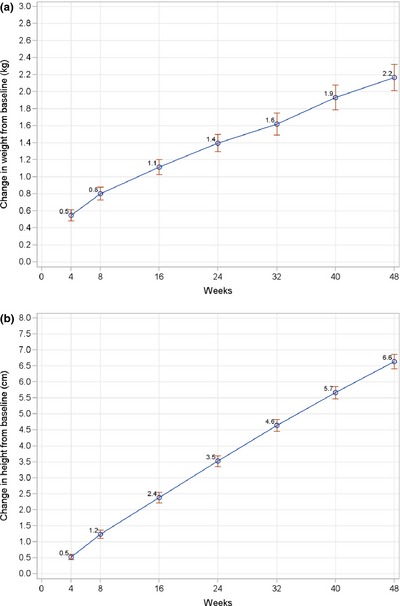
Line graphs of mean change in weight (kg) (a) and height (cm) (b) from baseline to each post‐baseline visit. Data points represent mean values; error bars represent 95% confidence intervals of the mean. P < 0.0001 for all post‐baseline visits compared to baseline; P‐value is from a paired t‐test.