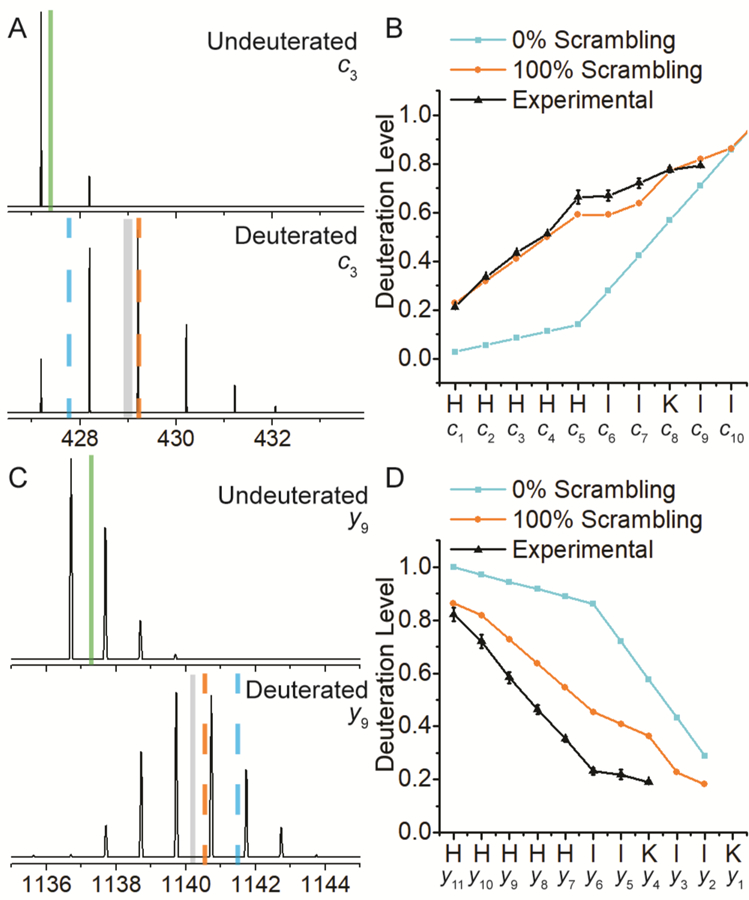
Figure 2.

Observed isotopic distributions of c3 (A) and y9 (C) fragment ions from nCID of the natural and deuterated peptide P1 (HHHHHHIIKIIK). The weighted average m/z value for each species is illustrated by a solid green (natural) or grey (deuterated) line. Theoretical deuteration levels for 100 and 0% scrambling are denoted with dashed orange (100%) and blue (0%) lines, respectively. Deuteration levels for all measured P1 nCID-derived c- (B) and y-type (D) fragment ions. Blue and orange lines represent expected deuteration levels for 0 and 100% scrambling, respectively.
