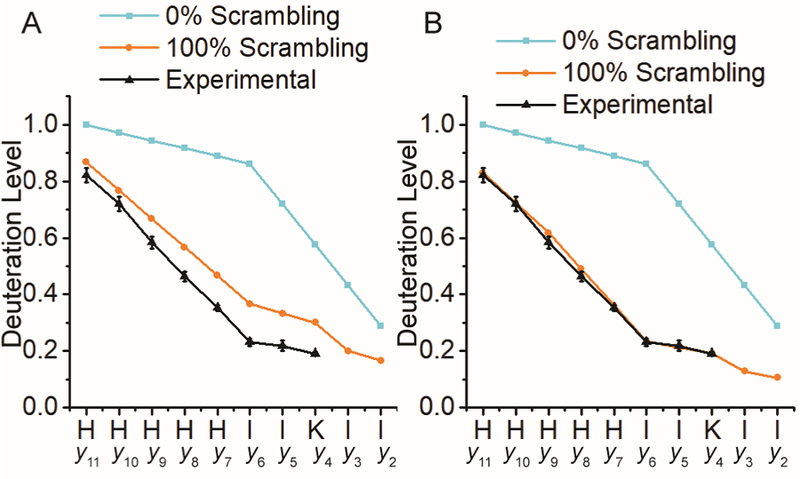
Figure 4.

nCID-generated P1 deuteration levels overlaid with 0% and 100% scrambling curves with the 100% curve being adjusted to account for hydrogen exchange at histidine C-2 carbon atoms (A) and adjusted to account for both histidine C-2 and Cβ hydrogen atom exchange (B).
