
Figure 3.
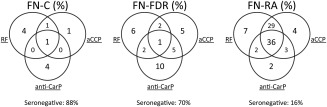
Distribution of seropositivity for rheumatoid factor (RF), anti–cyclic citrullinated peptide (anti‐CCP) antibodies, and anti‐CarP antibodies in FN controls (n = 77), FN FDRs (n = 105), and FN patients with RA (n = 92). Each circle represents a different autoantibody, and the numbers represent the percentage of subjects positive for the autoantibody or autoantibody combination. Only samples with data on all 3 autoantibodies were used to calculate the percentages (3 FN patients with RA, 4 FDRs, and 8 FN controls did not have all 3 antibodies measured). The percentage of subjects who were seronegative for all 3 antibodies is also shown. See Figure 1 for other definitions.