
Figure 2.
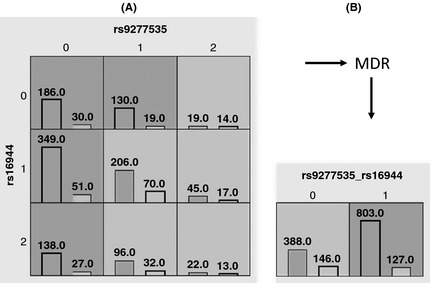
Summary of the best MDR model (rs9277535 + rs16944). (A) A two‐locus model has nine multifactorial cells, each of which is filled with the distribution of cases (left bars) and controls (right bars) for the corresponding genotypes. Each cell is labelled either ‘high risk’ (dark‐grey) or ‘low risk’ (light‐grey) based on its case–control ratio. For rs9277535, 0, 1, and 2 represent the genotypes GG, GA and AA respectively. This has also been adopted for rs16944. (B) A new single attribute is constructed by pooling the ‘high‐risk’ genotype combinations into a single group (1) and the ‘low‐risk’ into another group (0).