Figure 3.

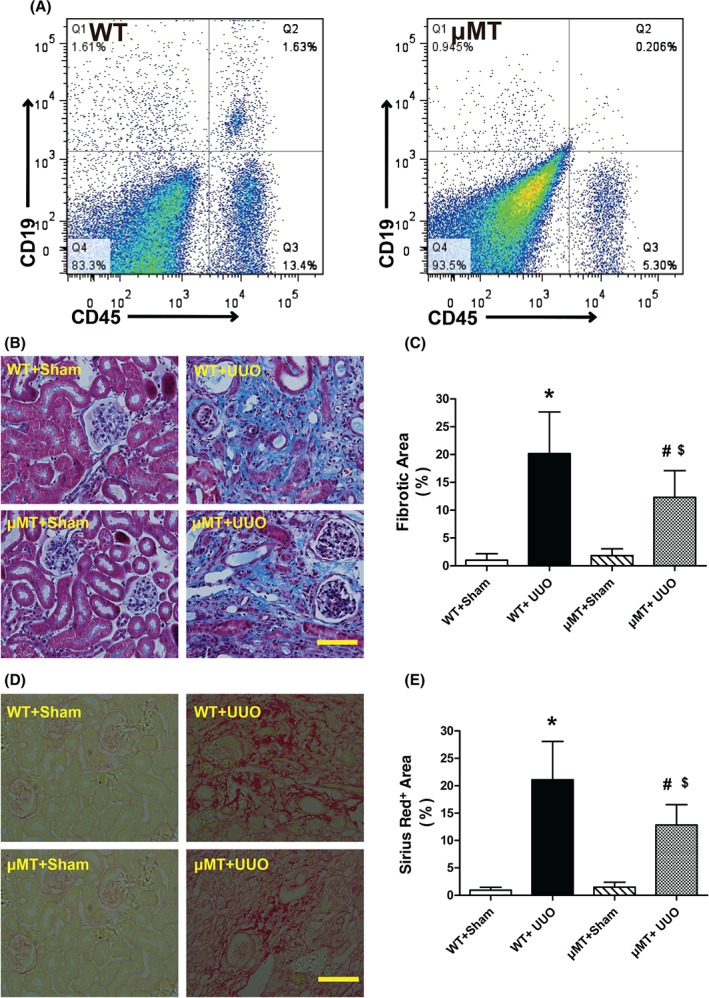
B‐cell‐deficient mice show decreased tubulointerstitial fibrosis after UUO. (A) Representative flow cytometry of renal CD45+CD19+ B lymphocytes in C57BL/6J (WT) and B‐cell‐deficient (μMT) mice. (B, C) Representative images and quantitative analysis of Masson's trichrome‐stained sections in sham‐operated WT (WT + sham), UUO model WT (WT + UUO), sham‐operated μMT mice (μMT + sham), and UUO model μMT (μMT + UUO) mice 2 weeks after surgery. Collagen is visible as the blue stain. Bar = 50 µm. (D, E) Representative images and quantitative analysis of renal Sirius red‐stained sections in WT + sham, WT + UUO, μMT + sham, and μMT + UUO mice 2 weeks after surgery. Collagen is visible as the red stain. Bar = 50 µm. * p < 0.05 versus WT+sham group; # p < 0.05 versus μMT + sham group; $ p < 0.05 versus WT + UUO group. Data are presented as mean ± SD (n = 6–8).
