Figure 6.

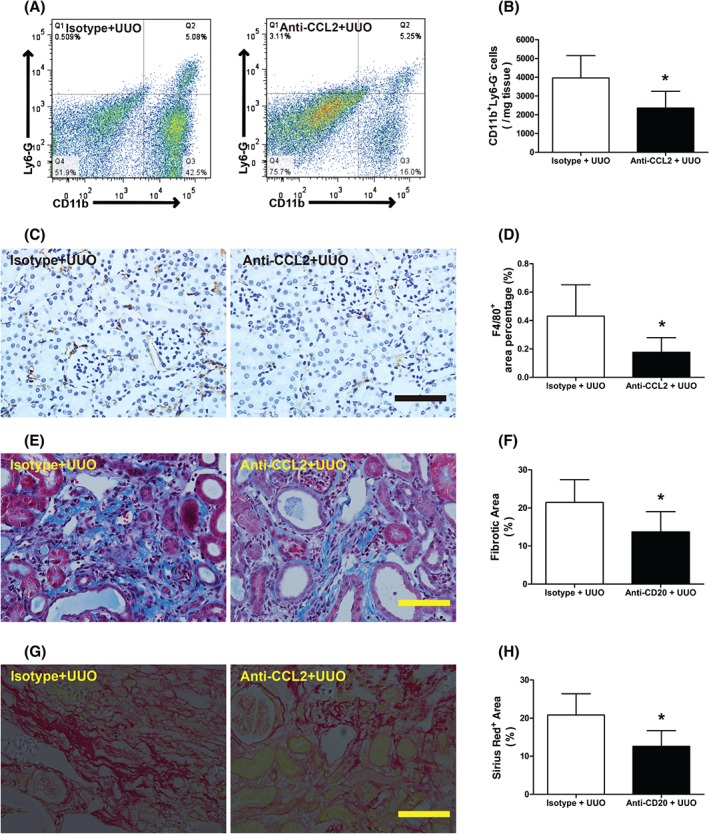
CCL2 depletion attenuates monocytic infiltration and fibrotic changes after UUO. (A, B) Representative flow cytometry and quantitative analysis of renal CD11b+Ly6‐G− macrophage staining in UUO model isotype antibody‐treated (isotype + UUO) and UUO model anti‐CCL2‐treated (anti‐CCL2 + UUO) mice 3 days after surgery. (C, D) Representative images and quantitative analysis of F4/80 staining in isotype + UUO and anti‐CCL2 + UUO mice 2 weeks after surgery. (E, F) Representative images and quantitative analysis of Masson's trichrome‐stained sections in isotype + UUO and anti‐CCL2 + UUO mice 2 weeks after surgery. Collagen is visible as the blue stain. (G, H) Representative images and quantitative analysis of Sirius red‐stained sections in isotype + UUO and anti‐CCL2 + UUO mice 2 weeks after surgery. Collagen is visible as the blue stain. Bar = 50 µm. *p < 0.05 versus isotype + UUO group. Data are presented as means ± SD (n = 6–8).
