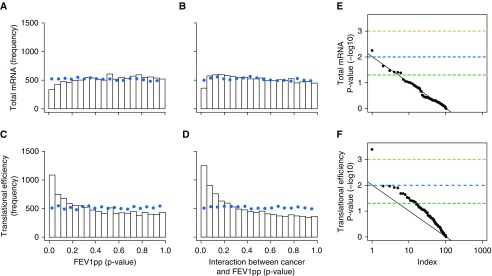
Figure 2.
The lung stromal proteome is predominantly modulated via changes in translational efficiency. (A–D) Histograms of P values for changes in total mRNA levels (A and B) and translational efficiencies (C and D) in ANCOVAs in which expression levels are related to age (not shown), cancer (not shown), FEV1pp (A and C), and the CFI (B and D) (n = 32). The dotted line indicates the frequency of these P values when the same analysis was performed on a randomly sampled data set. (E) Quantile-quantile plot of rank (“Index” plotted on a log10 scale) by P value (−log10) for the CFI analyzed using total mRNA data (i.e., B) and their corresponding P values (for proteins with a low P value [<0.05] CFI according to mass spectrometry, i.e., Figure 1B, right). (F) Plots similar to those shown in E based on analysis of translational efficiency. (E and F) The black line indicates the relationship expected by chance, and data points above the line indicate enrichment of low P values. Dashed lines indicate a P value of 0.05 (green), 0.01 (blue), or 0.001 (orange). ANCOVA = analysis of covariance; CFI = cancer status–FEV1pp interaction; FEV1pp = FEV1 percent of the predicted value.

