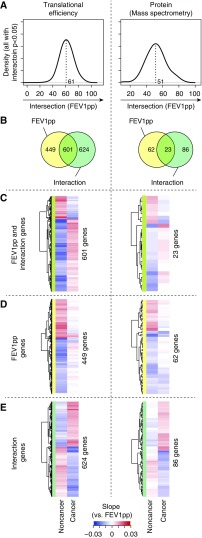
Figure 3.
Distinct FEV1pp-dependent stromal gene expression in samples from patients with or without cancer. (A) Distributions of intersections (i.e., for the regression slopes relating gene expression to FEV1pp for subjects with cancer vs. subjects without cancer) for mRNAs with translational efficiencies or proteins with a low P value (P < 0.05) for the CFI. The dotted black line indicates the peak of the density. (B) Venn diagrams comparing genes that show FEV1pp-dependent expression in subjects without cancer (P < 0.05, FEV1pp) with those that show a CFI (P < 0.05, Interaction). (C–E) Heatmaps of slopes for the relationship between gene expression and FEV1pp for subsets of genes from sectors of the Venn diagram. (A–E) The analysis was performed separately on translational efficiency (n = 32) and protein levels (n = 58). CFI = cancer status–FEV1pp interaction; FEV1pp = FEV1 percent of the predicted value.

