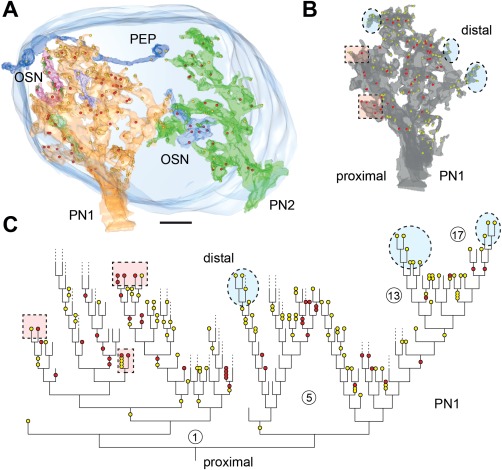
Figure 10.

Synapse mapping in glomerulus DL5. A: In this reconstruction the glomerulus DL5 is shaded in blue. Two projection neuron (PN) profiles (PN1 and PN2) occupied separate regions of the glomerulus and probably belong to different PN cells because their proximal shafts enter the glomerulus at different sites. The neurite volume of PN profiles in which presynaptic (red dots) and postsynaptic (yellow dots) sites were identified is 35 µm3 for PN1 (in yellow) and 15 µm3 for PN2 (in green). OSN, olfactory sensory neuron (OSN)‐type profiles; PEP, a putative peptidergic neuron. See also the interactive 3D pdf in Supplementary Fig. S7). B: A reconstruction of the PN1 dendritic tree. Shaded and encircled areas refer to the location of synapses as shown in C. C: Dendrogram depicting the distribution of input (yellow) and output (red) synapses along different branching levels of the PN dendritic tree from level 1 (the entry neurite, proximal) to level 17 (the PN terminal branches, distal). Dashed lines indicate that the respective arbor could not be followed. Note that individual branches might terminate at any arborizations level starting at level 2. The number of synapses increases with the degree of arborization. At levels 0–4 and 15–17, solely input synapses were found. Levels 5–15 are a mixed zone of input and output synapses. Output synapses were found most frequently at levels 6–12. At terminal branches solely input synapses (blue, encircled), or terminals with input/output synapses (pink, encircled) were found. The number of terminals without synapses is 16 ( = approximately 20%). Scale bar = 3 µm in A.
