
Figure 14.
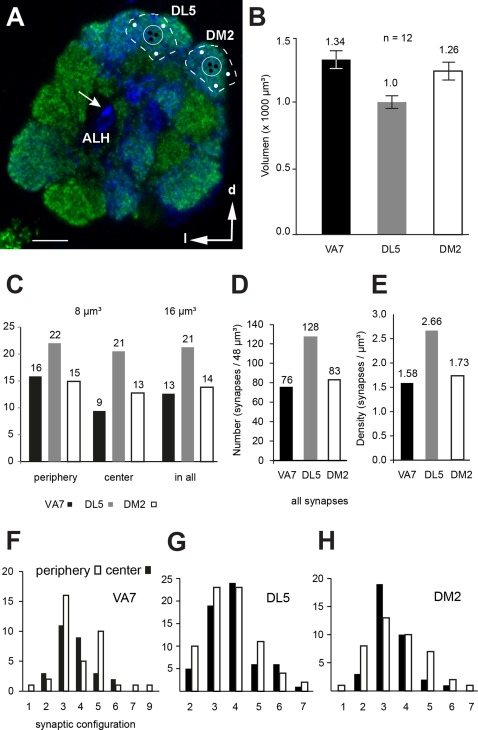
Quantitative analysis of synapse number within glomerular microvolumes. A: Synaptic counts of presynaptic sites (output synapses) in microvolumes (MV) located in either the center or the periphery of the three studied glomeruli (here shown for the DL5 and DM2 glomerulus, encircled). In each glomerulus six MV were chosen for the center (black dots) and the periphery (white dots). The total counting volume is 48 µm3 for each glomerulus, which is approximately 4–5% of the total volume of the given glomerulus. All neuronal profiles, labeled and nonlabeled, were analyzed. Arrow indicates the origin of the median antennal lobe tract, ALH, antennal hub; d, dorsal; l, lateral. Image courtesy of Y.Seki. B: Volume measurements of glomeruli VA7, DL5, and DM2 in males from Drosophila melanogaster of the left and right antennal lobe derived from confocal scans (n = 12 glomeruli from the left and right hemisphere in six animals). C–E: Synaptic number of presynaptic sites, for the VA7, DL5, and DM2 glomerulus, averaged from three MV counts in the periphery (each 8 µm3) and in the center of each glomerulus (each 8 µm3), respectively; “in all” indicates the average counts summed from periphery and center (volume of 16 µm3). D: Synaptic configuration for all presynapses found in all 12 microvolumes, i.e., the absolute number of synapses for all three glomeruli (each volume is 48 µm3). E: Density of synapses per cubic micrometer. F–H: Synaptic configuration of synapses in the periphery and in the center the VA7, DL5, and DM2 glomerulus; most are triad and tetrad constellations. Scale bar = 10 µm in A.